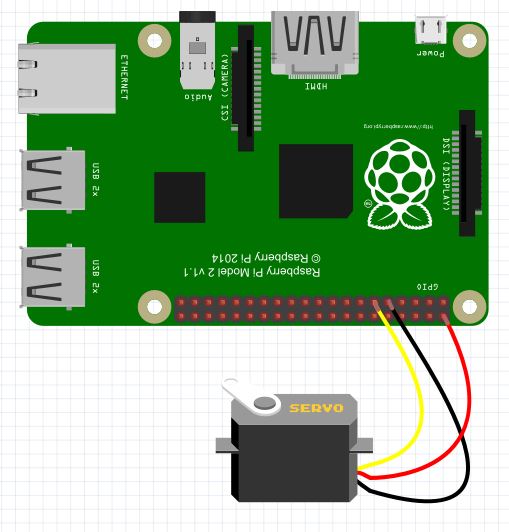
In this lesson we will show you how to precisely control a Servo using the Raspberry Pi. First, for the small servo I am using, I have verified that it is safe to drive from the 5 volt pin (physical pin 2) on the Raspberry Pi. It is possible to damage your Raspberry Pi by drawing too much current out of a pin. So, if you are not sure about the current requirements of your Servo, it is best to power it from a 5 Volt source other than a Raspberry Pi pin. You can still control it from the Raspberry Pi if you use a common ground, but just get the power (red wire) from an external source. For my small servo, I can safely power it from Raspberry Pi physical pin 2.
The second point is that to control the servo, you have to use Pulse Width Modulation. So, I STRONGLY recommend that you go through LESSON 27 if you have not already. Lesson 27 shows you how to use PWM on the GPIO pins on the Raspberry Pi. If you are up to speed on PWM, this lesson will go a lot easier.
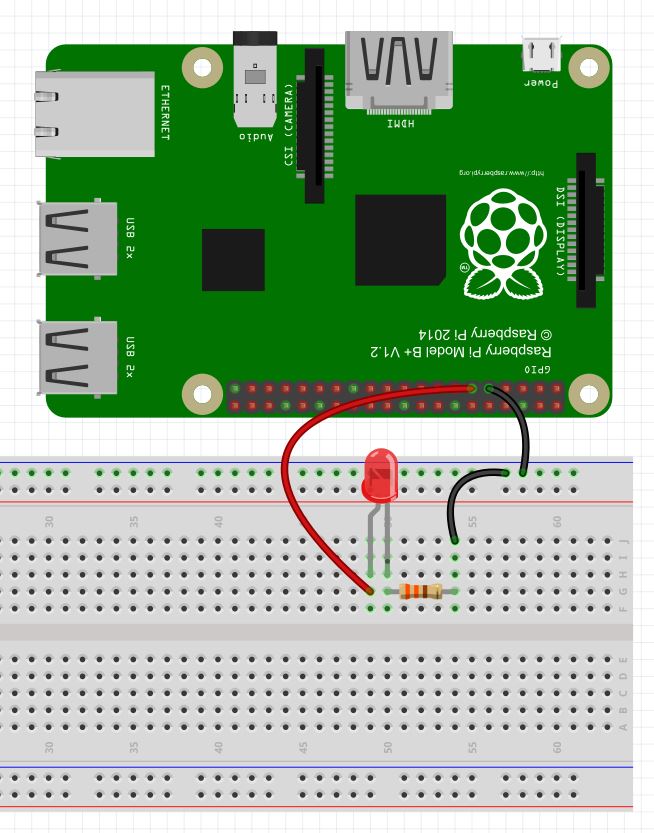
So, with that out of the way, we are ready to hook up our servo. For my servo, the ground wire is Black, the Red wire is 5 volt, and the yellow wire is the control line. If you are using a different servo, you will need to read the instructions to see what the color code is for your three wires, but it is likely similar to mine. The sketch below shows how you should hook the servo up. Notice I have the 5V hooked to the Pi physical pin 2, the servo ground hooked to the Pi physical pin 9, and the servo control line hooked to the Pi physical pin 11.
Now with the Servo hooked up, we are ready to try and control it. For this example, we will work in the Python shell. To enter the python shell, open a Terminal window, and at the command prompt type:
$sudo python
It is important to include sudo, as the Raspberry Pi only allows access to the GPIO pins to the superuser. Hence, you need to enter the python shell as a superuser. When you type the command above, you should be moved into the Python shell, and should see the python shell prompt of >>>.
We are now ready to control the servo. We must first import the RPi library. These first steps should be familiar if you did LESSON 27.
>>>import RPi.GPIO as GPIO
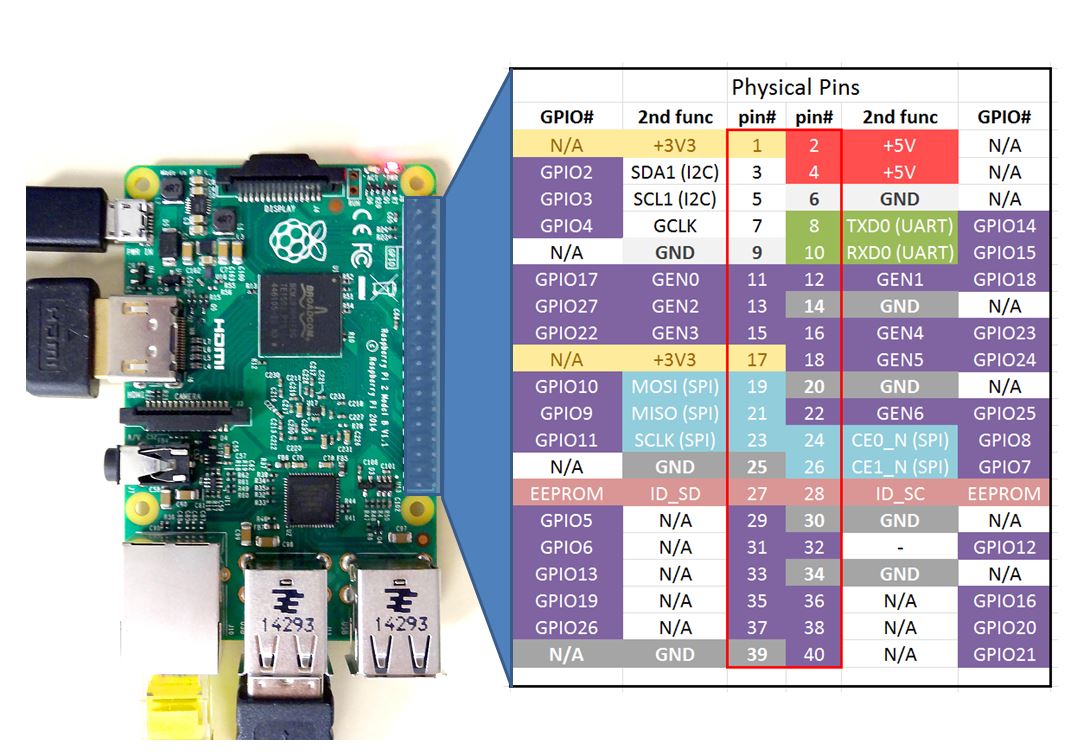
Now we need to tell the Pi what pin numbering scheme we want to use. I like to use the physical pin numbers (See LESSON 25 for a diagram). So, we need to issue the command:
>>>GPIO.setmode(GPIO.BOARD)
Now we need to tell the Pi that physical pin 11 will be an output pin:
>>>GPIO.setup(11,GPIO.OUT)
The servos position is controlled by the pulsewidth of a 50 Hz PWM signal. Hence, we need to turn the PWM sequence on at 50 Hz. Note that for a 50 Hz signal, the Period of the signal is 1/50=.02 seconds, or 20 milliseconds. Keep this Period in mind as we will come back to it later. We start by creating a PWM object on Pin 11 with a 50 Hz signal with the command:
>>>pwm=GPIO.PWM(11,50)
We can now start the pwm sequence by giving a command to specify the DutyCycle of the signal. Before we do this, we need to talk a little bit about how servos work. A typical servo wants to see a frequency of 50 Hz on the control line. The position it moves to depends on the pulse width of the signal. Most servos behave roughly as such, but you will need to tweak these numbers for your particular servo. Typically, the servo will go to the full left position when it sees a pulse width of 1 millisecond, it will go the middle position when it sees a pulse width of 1.5 millisecond, and it will go to the full right position when it sees a pulse width of 2 millisecond. Note however, that on the Raspberry Pi we do not specify a pulse width, but we specify a DutyCycle. So, we can use the following relationship:
DutyCycle =PulseWidth/Period
Remember that Period = 1/frequency, so:
DutyCycle = PulseWidth/(1/frequency) = PulseWidth * frequency
The PulseWidth that will give us a full left position is 1 milllisecond. We now calculate the applied DutyCycle to give us the desired position:
DutyCycle = PulseWidth*frequency=.001 *50 = .05 = 5%
So, for a 50 Hz signal, if we set the DutyCycle to 5, then we should see the servo move to the full left position. Similarly, if we set DutyCycle to 7.5, we should get the middle position, and if we set it to 10 we should be in the full right position. You can get all the intermediate positions by linearly scaling between 5 and 10. Note that these values will vary between brands, and between individual servos, so play around with your servo to get it calibrated. We are now ready to apply a command to position the servo. If we want the servo in the full left position, we should set the DutyCycle to 5%. We do that with the command:
>>>pwm.start(5)
This will start the PWM signal, and will set it at 5%. Remember, we already specified the 50 Hz signal when we created the pwm object in our earlier commands. Now if we want to change the position, we can change the DutyCycle. For example, if we want to go to the middle position, we want a DutyCycle of 7.5, which we can get with the command:
>>>pwm.ChangeDutyCycle(7.5)
Now if we want the full right position, we want a duty cycle of 10, which we would get with the command:
>>>pwm.ChangeDutyCycle(10)
Remember, it is not DutyCycle that actually controls servo position, it is PulseWidth. We are creating DutyCycles to give us the desired PulseWidth.
Now, play around with your particular servo and then find the specific DutyCycles that lead to full left and full right positions. For my servo, I find that full left is at DutyCycle=2, and full right is at DutyCycle=12. With these values, I can create a linear equation that will give me any angle I want between 0 and 180. This will make the Raspberry Pi behave much more like the simple and intuitive operation of the Arduino.
To do the linear equation I need two points. Well, I know that for a desired angle of 0, I should apply a DutyCycle of 2. This would be the point (0,2). Now I also know that for a desired angle of 180, I should apply a DutyCycle of 12. This would be the point (180,12). We now have two points and can calculate the equation of the line. (Remember, play with your servo . . . your numbers might be slightly different than mine, but the methodology below will work if you use your two points)
Remember slope of a line will be:
m=(y2-y1)/(x2-x1)=(12-2)/180-0)=10/180 = 1/18
We can now get the equation of the line using the point slope formula.
y-y1=m(x-x1)
y-2=1/18*(x-0)
y = 1/18*x + 2
Putting in our actual variables, we get
DutyCycle = 1/18* (DesiredAngle) + 2
Now to change to that position, we simply use the command:
pwm.ChangeDutyCycle(DutyCycle)
I hope this makes sense. Watch the video as I step you through it carefully. If the writeup above does not make sense, hopefully the video will clear things up.