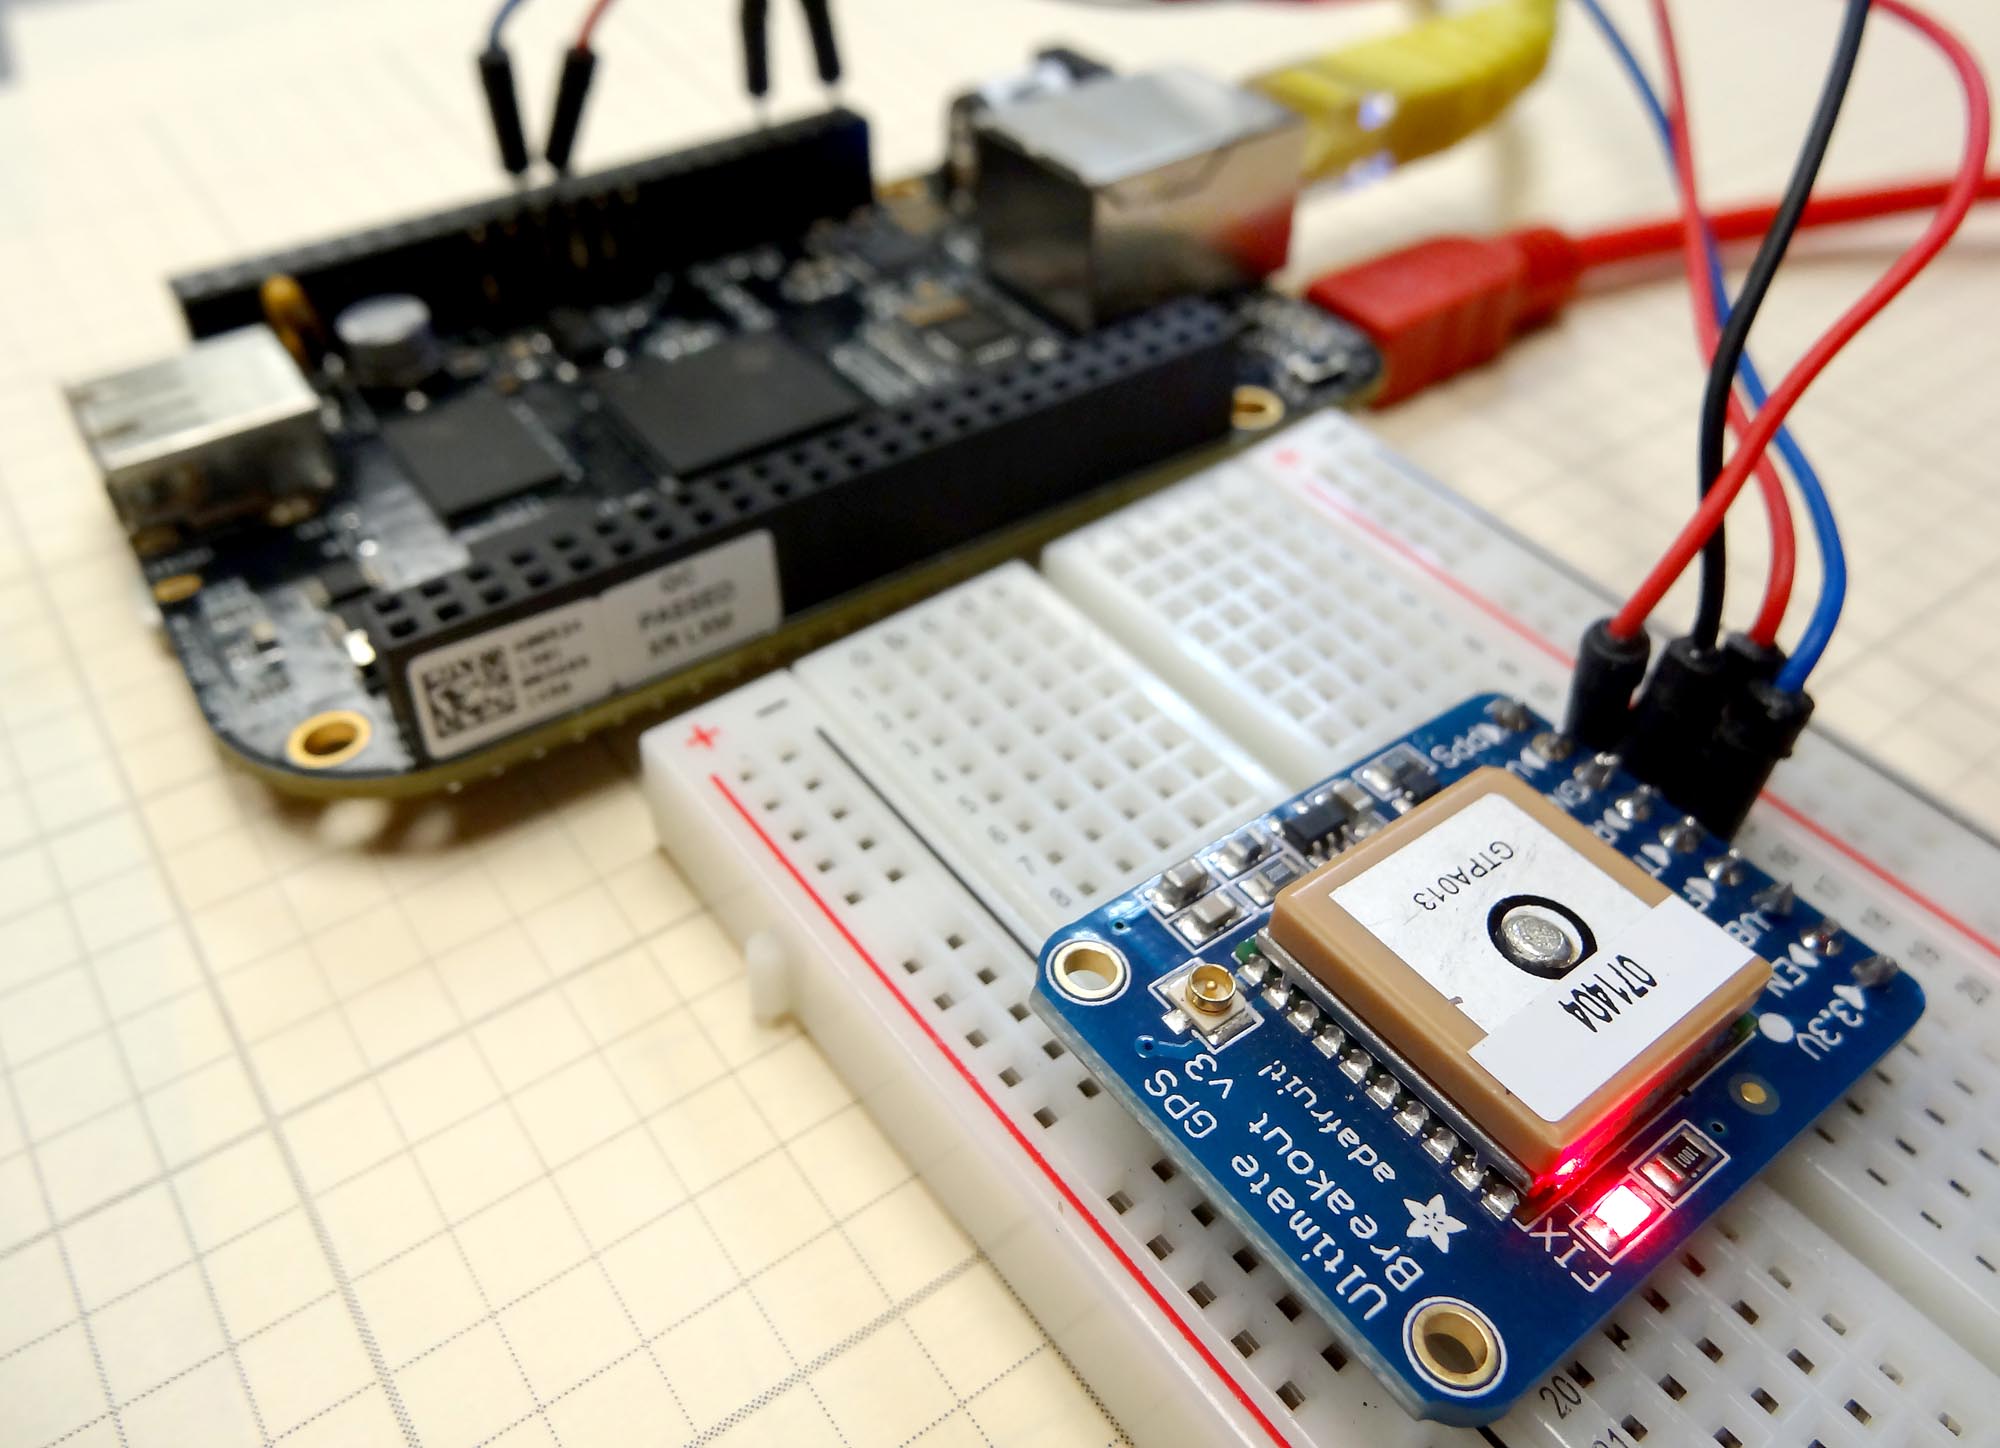
In lesson 1 we showed you how to connect the Adafruit Ultimate GPS breakout board to the Beaglebone Black and how to read the NMEA sentences streaming off the GPS over the UART pins. In this lesson we will show you how to send commands to the GPS to better tailor its operation for our needs. There are a number of commands that can be sent to it. Some of the things we we can control are the baud rate it communicates at, and the rate that it takes and sends data. We can also influence which NMEA sentences it sends. In this video we will go over the different commands we can use.
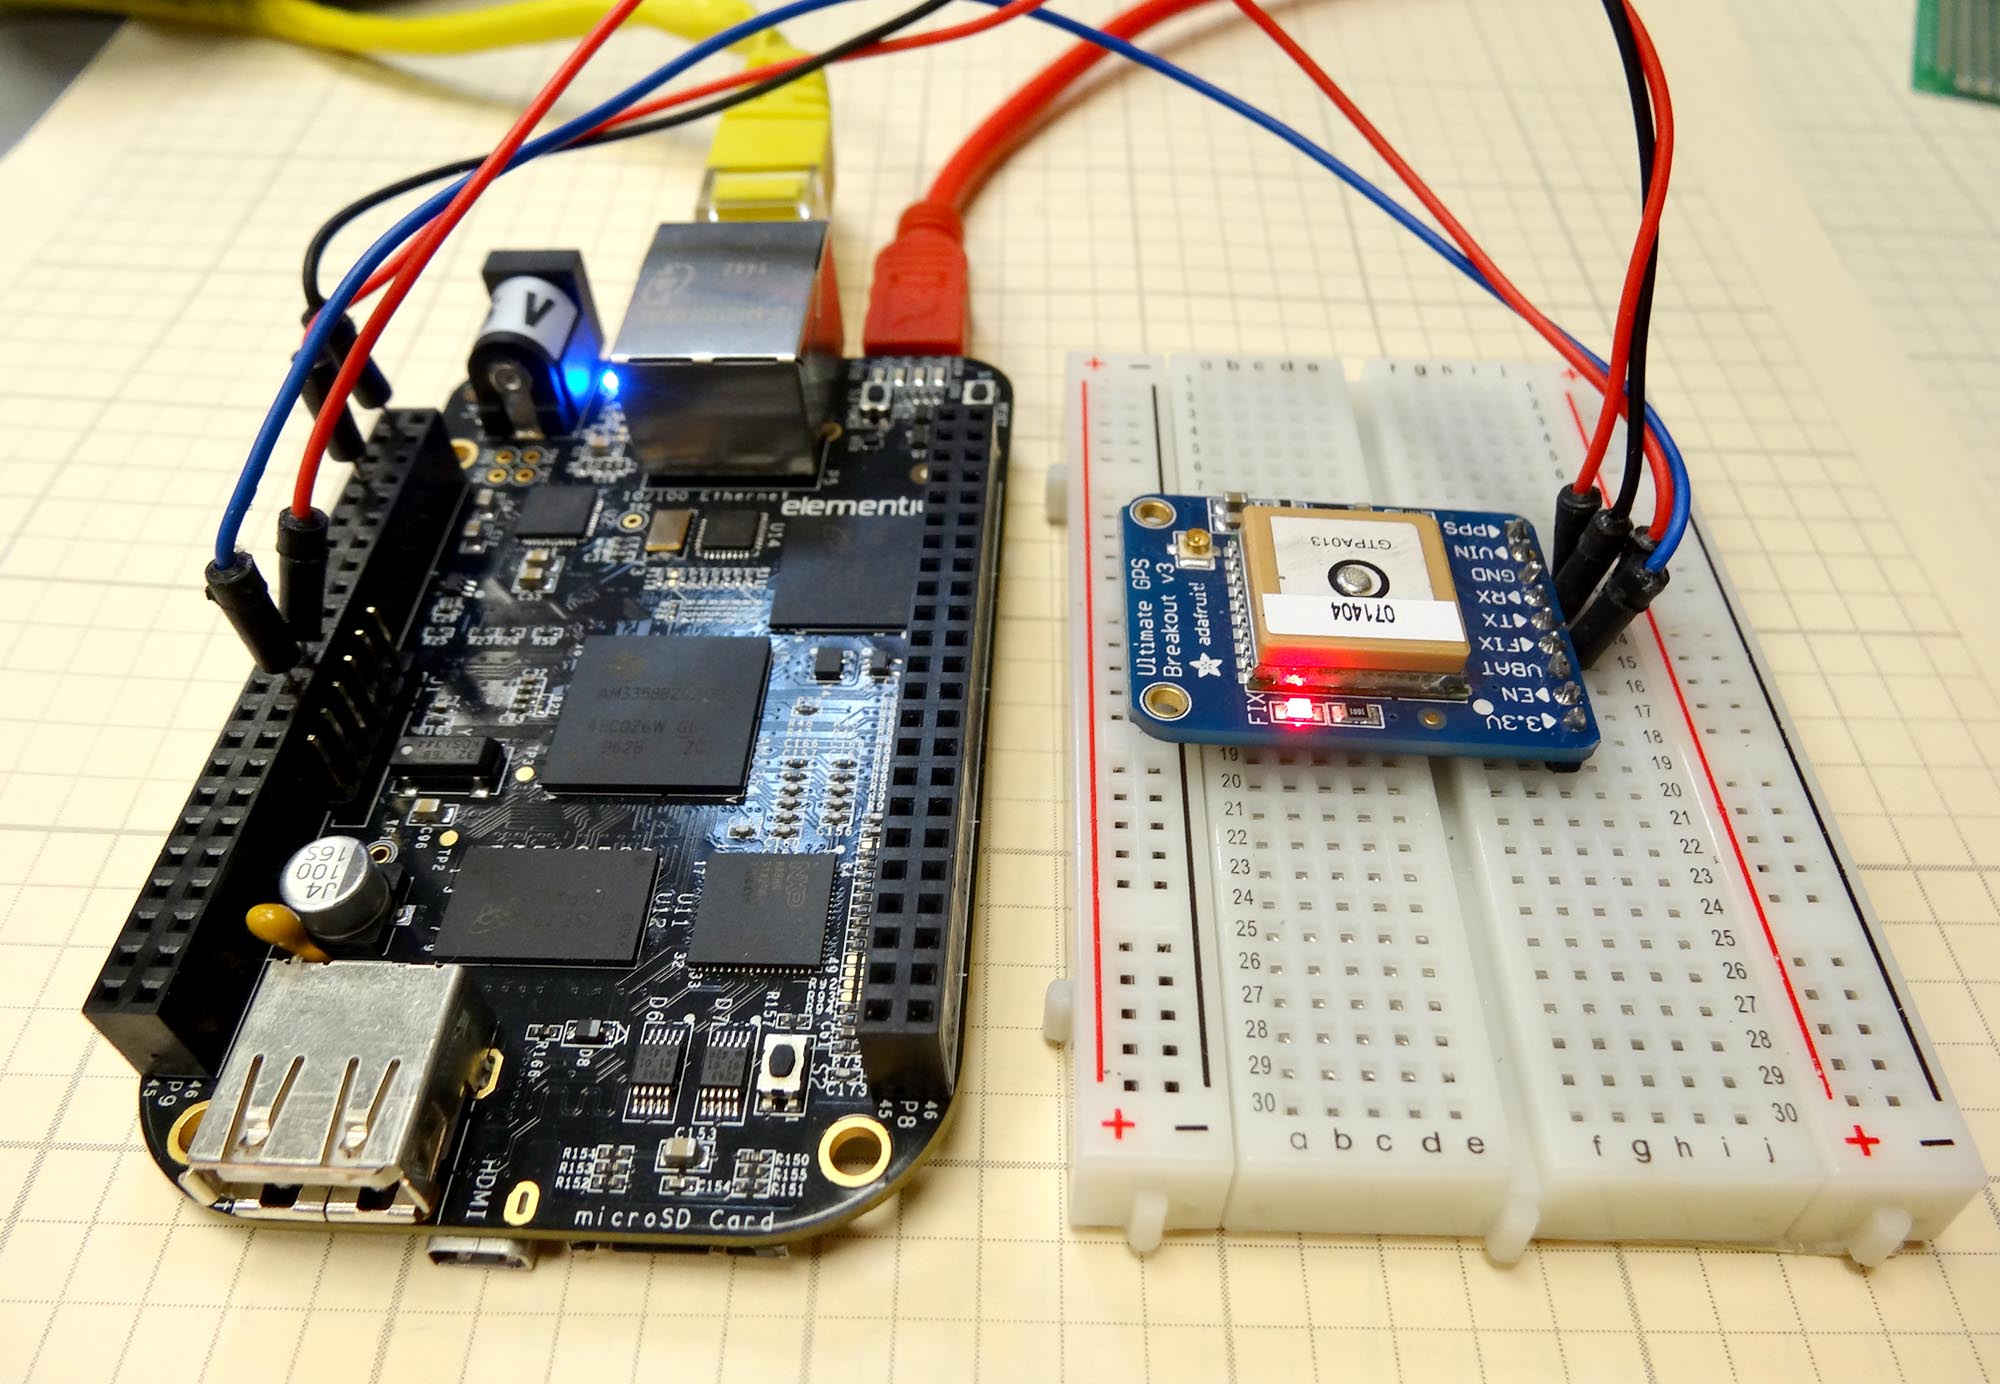
To review, you should connect the GPS as follows:

The video explains the code step-by-step, but here it is for your reference.
|
1 2 3 4 5 6 7 8 9 10 11 12 13 14 15 16 17 18 19 20 21 22 23 24 25 26 27 28 29 30 31 32 33 34 35 36 37 38 39 40 41 42 43 44 45 46 47 48 49 50 51 |
import serial #import pyserial library import Adafruit_BBIO.UART as UART #import UART Library UART.setup("UART1") #Initialize UART1 ser=serial.Serial('/dev/ttyO1',9600) #Initialize Serial Port from time import sleep #import sleep library class GPS: #Create GPS class def __init__(self): #This init will run when you create a GPS object. #This sets up variables for useful commands. #This set is used to set the rate the GPS reports UPDATE_10_sec= "$PMTK220,10000*2F\r\n" #Update Every 10 Seconds UPDATE_5_sec= "$PMTK220,5000*1B\r\n" #Update Every 5 Seconds UPDATE_1_sec= "$PMTK220,1000*1F\r\n" #Update Every One Second UPDATE_200_msec= "$PMTK220,200*2C\r\n" #Update Every 200 Milliseconds #This set is used to set the rate the GPS takes measurements MEAS_10_sec = "$PMTK300,10000,0,0,0,0*2C\r\n" #Measure every 10 seconds MEAS_5_sec = "$PMTK300,5000,0,0,0,0*18\r\n" #Measure every 5 seconds MEAS_1_sec = "$PMTK300,1000,0,0,0,0*1C\r\n" #Measure once a second MEAS_200_msec= "$PMTK300,200,0,0,0,0*2F\r\n" #Meaure 5 times a second #Set the Baud Rate of GPS BAUD_57600 = "$PMTK251,57600*2C\r\n" #Set Baud Rate at 57600 BAUD_9600 ="$PMTK251,9600*17\r\n" #Set 9600 Baud Rate #Commands for which NMEA Sentences are sent GPRMC_ONLY= "$PMTK314,0,1,0,0,0,0,0,0,0,0,0,0,0,0,0,0,0,0,0*29\r\n" #Send only the GPRMC Sentence GPRMC_GPGGA="$PMTK314,0,1,0,1,0,0,0,0,0,0,0,0,0,0,0,0,0,0,0*28\r\n"#Send GPRMC AND GPGGA Sentences SEND_ALL ="$PMTK314,1,1,1,1,1,1,0,0,0,0,0,0,0,0,0,0,0,0,0*28\r\n" #Send All Sentences SEND_NOTHING="$PMTK314,0,0,0,0,0,0,0,0,0,0,0,0,0,0,0,0,0,0,0*28\r\n" #Send Nothing ser.write(BAUD_57600) #Set Baud Rate to 57600 sleep(1) #Paulse ser.baudrate=57600 #IMPORTANT Since change ser baudrate to match GPS ser.write(UPDATE_200_msec) #Set update rate sleep(1) ser.write(MEAS_200_msec) #Set measurement rate sleep(1) ser.write(GPRMC_GPGGA) #Ask for only GPRMC and GPGGA Sentences sleep(1) ser.flushInput() #clear buffers ser.flushOutput() print "GPS is Initialized" #Print message myGPS=GPS() while(1): ser.flushInput() #Clear Buffers ser.flushInput() while ser.inWaiting()==0: #Wait for input pass NMEA1=ser.readline() #Read NMEA1 while ser.inWaiting()==0: pass NMEA2=ser.readline() print NMEA1 print NMEA2 |
This code sets the GPS to communicate at baud rate of 57600, and set it to read and report 5 readings a second. It then sets the GPS to only report the $GPRMC and the $GPGGA sentences. It then constantly reads and reports the NMEA sentences.