In this lesson we will extend what we did in lesson 22 to include a data logger with our GPS. You should be sure and do lesson 22 first, as that shows you how to hook up and program the GPS. In this project we will connect an SD Card Reader/Writer, and will power the whole thing with a 9 Volt battery. With this, you can walk around, and the device will constantly monitor and log your position. You can then bring it back inside, and look at where you have been using Google Earth.
To start with, lets talk about what you will need to do this project. As described earlier, you need to start by doing lesson 22 which will get you going on the GPS hookup and initial software. Now, to move forward, you will need an Arduino, Adafruit Ultimate GPS, Virtuabotix SD card reader, and a Battery Clip to power the arduino during your mobile jaunts. You will need a 9V battery. If you are going to be doing a lot of mobile work, it is probably worth it to invest in a good 9v Rechargable battery system.
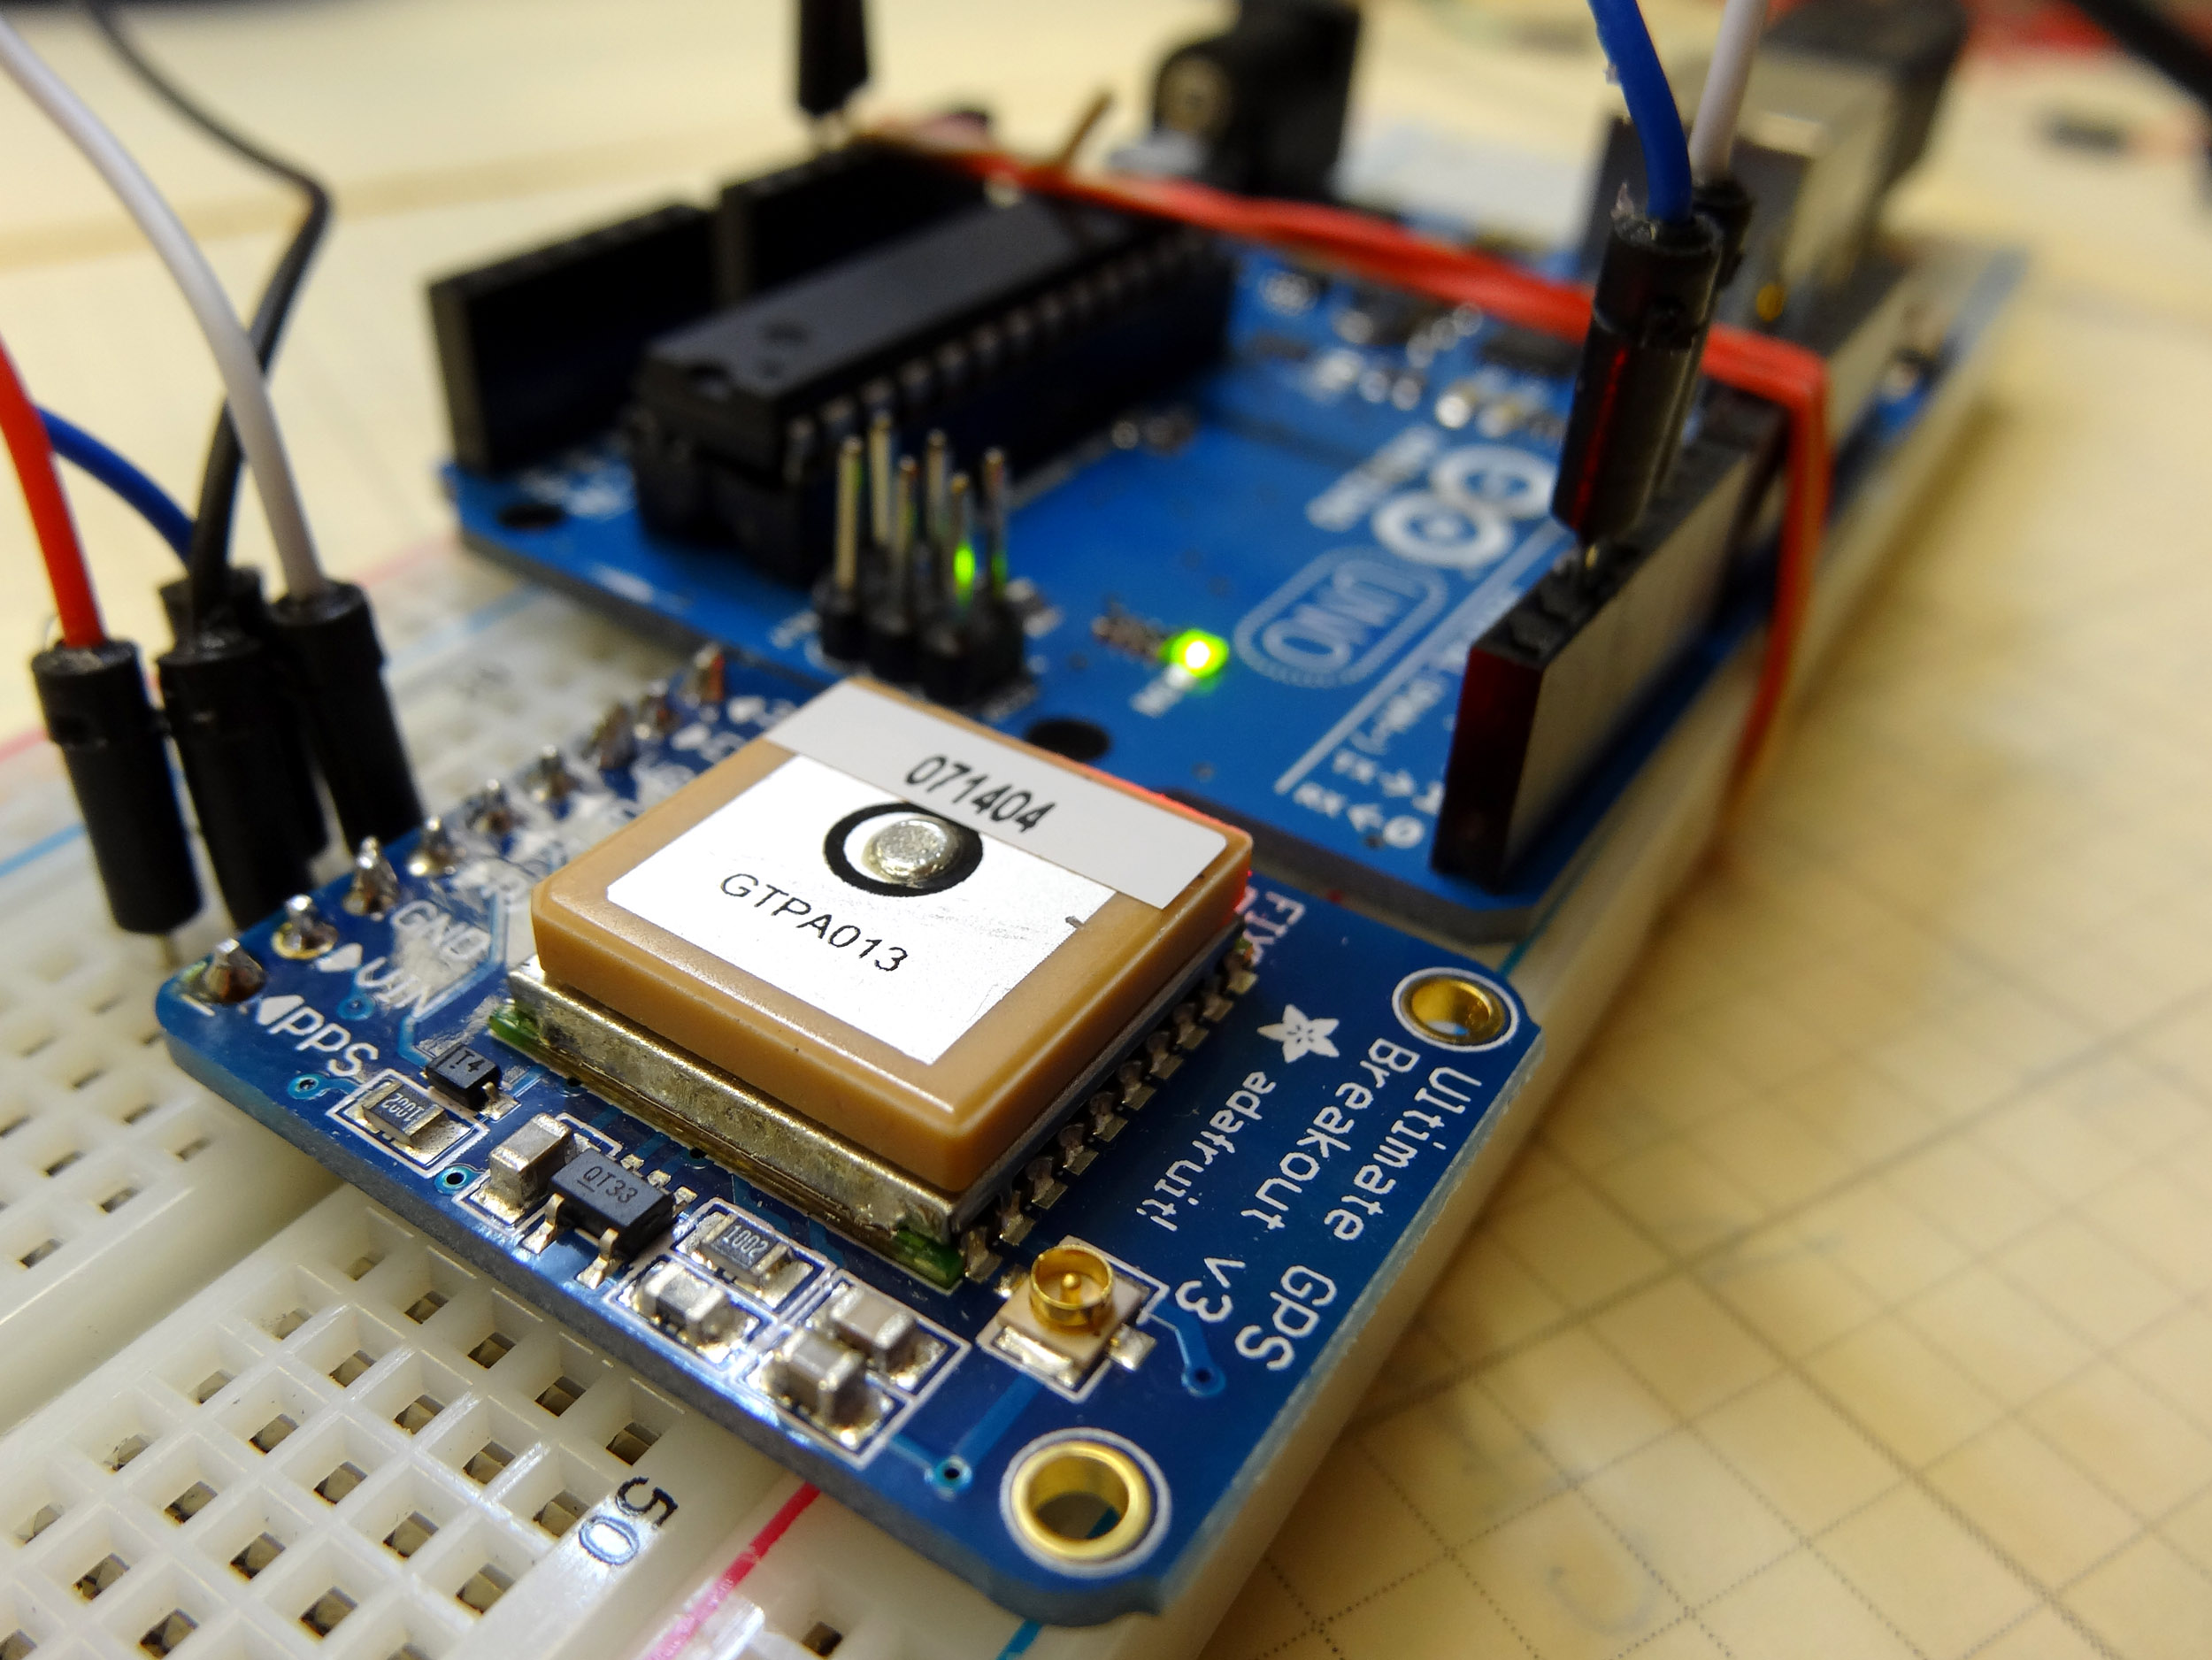
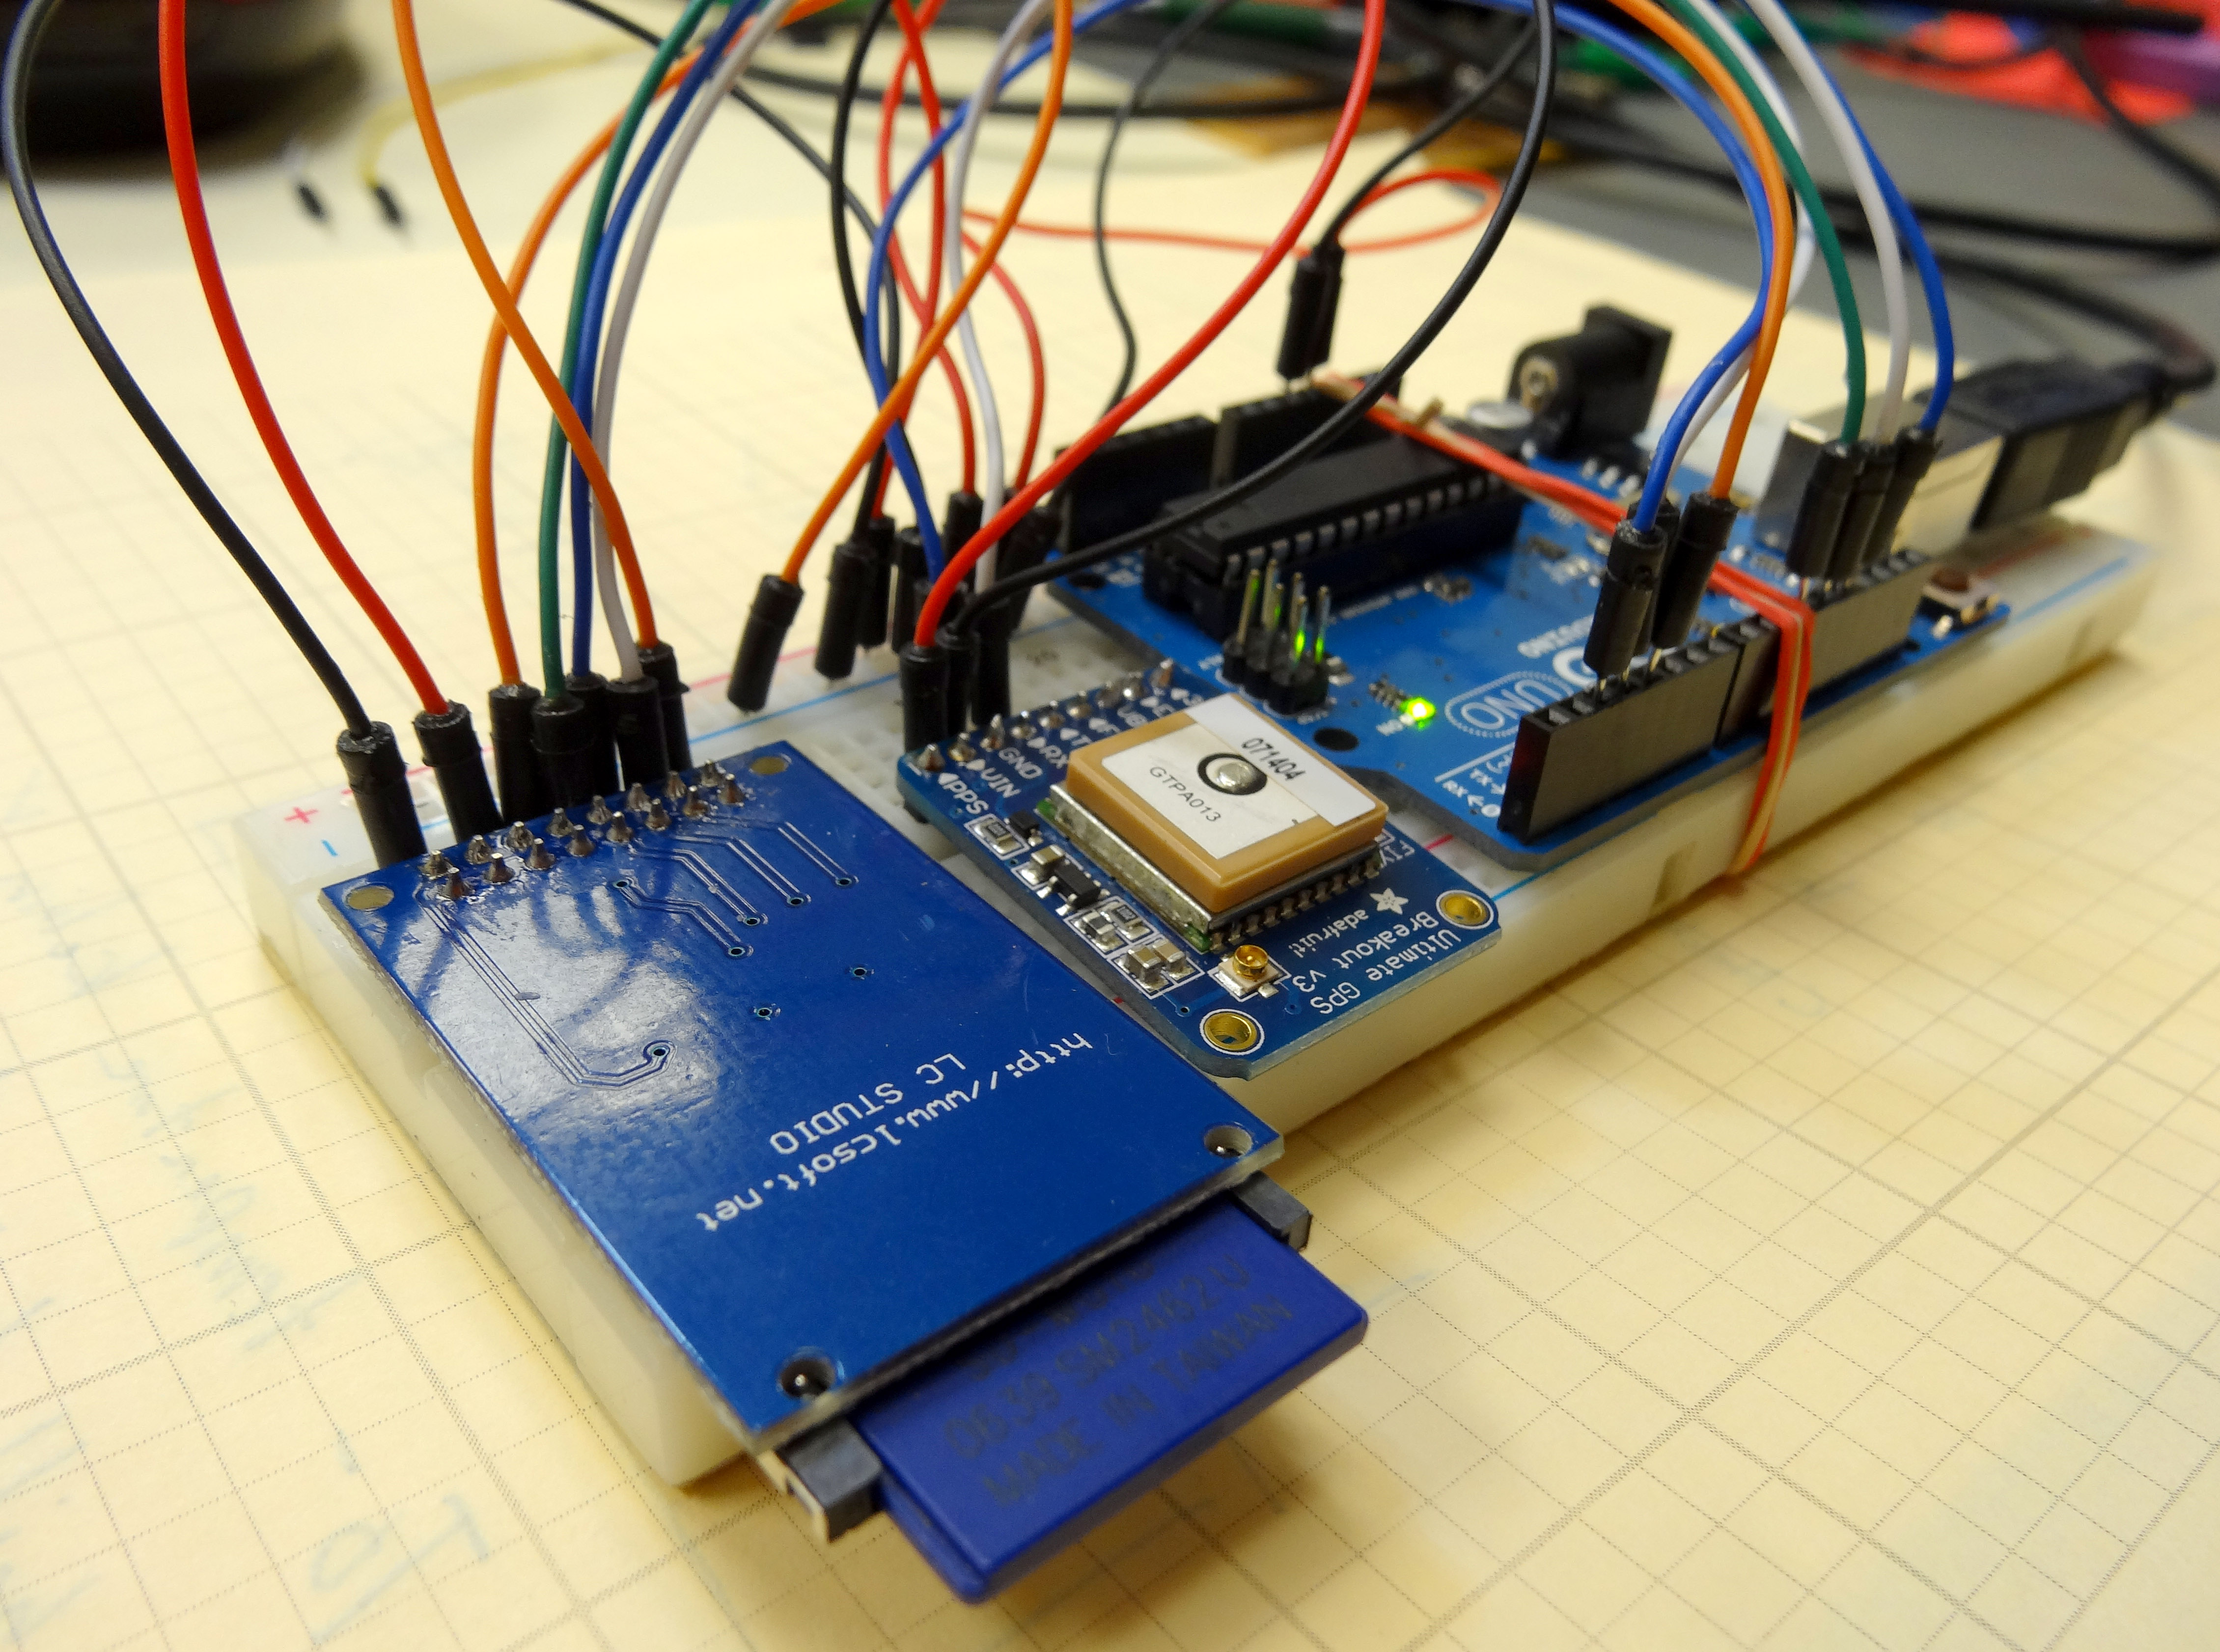
When you get your gear gathered up, you will be ready to get this project going. First, hook the GPS up to the arduino as we did in lesson 22:
Connecting the Adafruit Ultimate GPS Unit to Arduino | |
| GPS Pin | Arduino Pin |
| Vin | 5V |
| GND | GND |
| RX | Pin 2 |
| TX | Pin 3 |
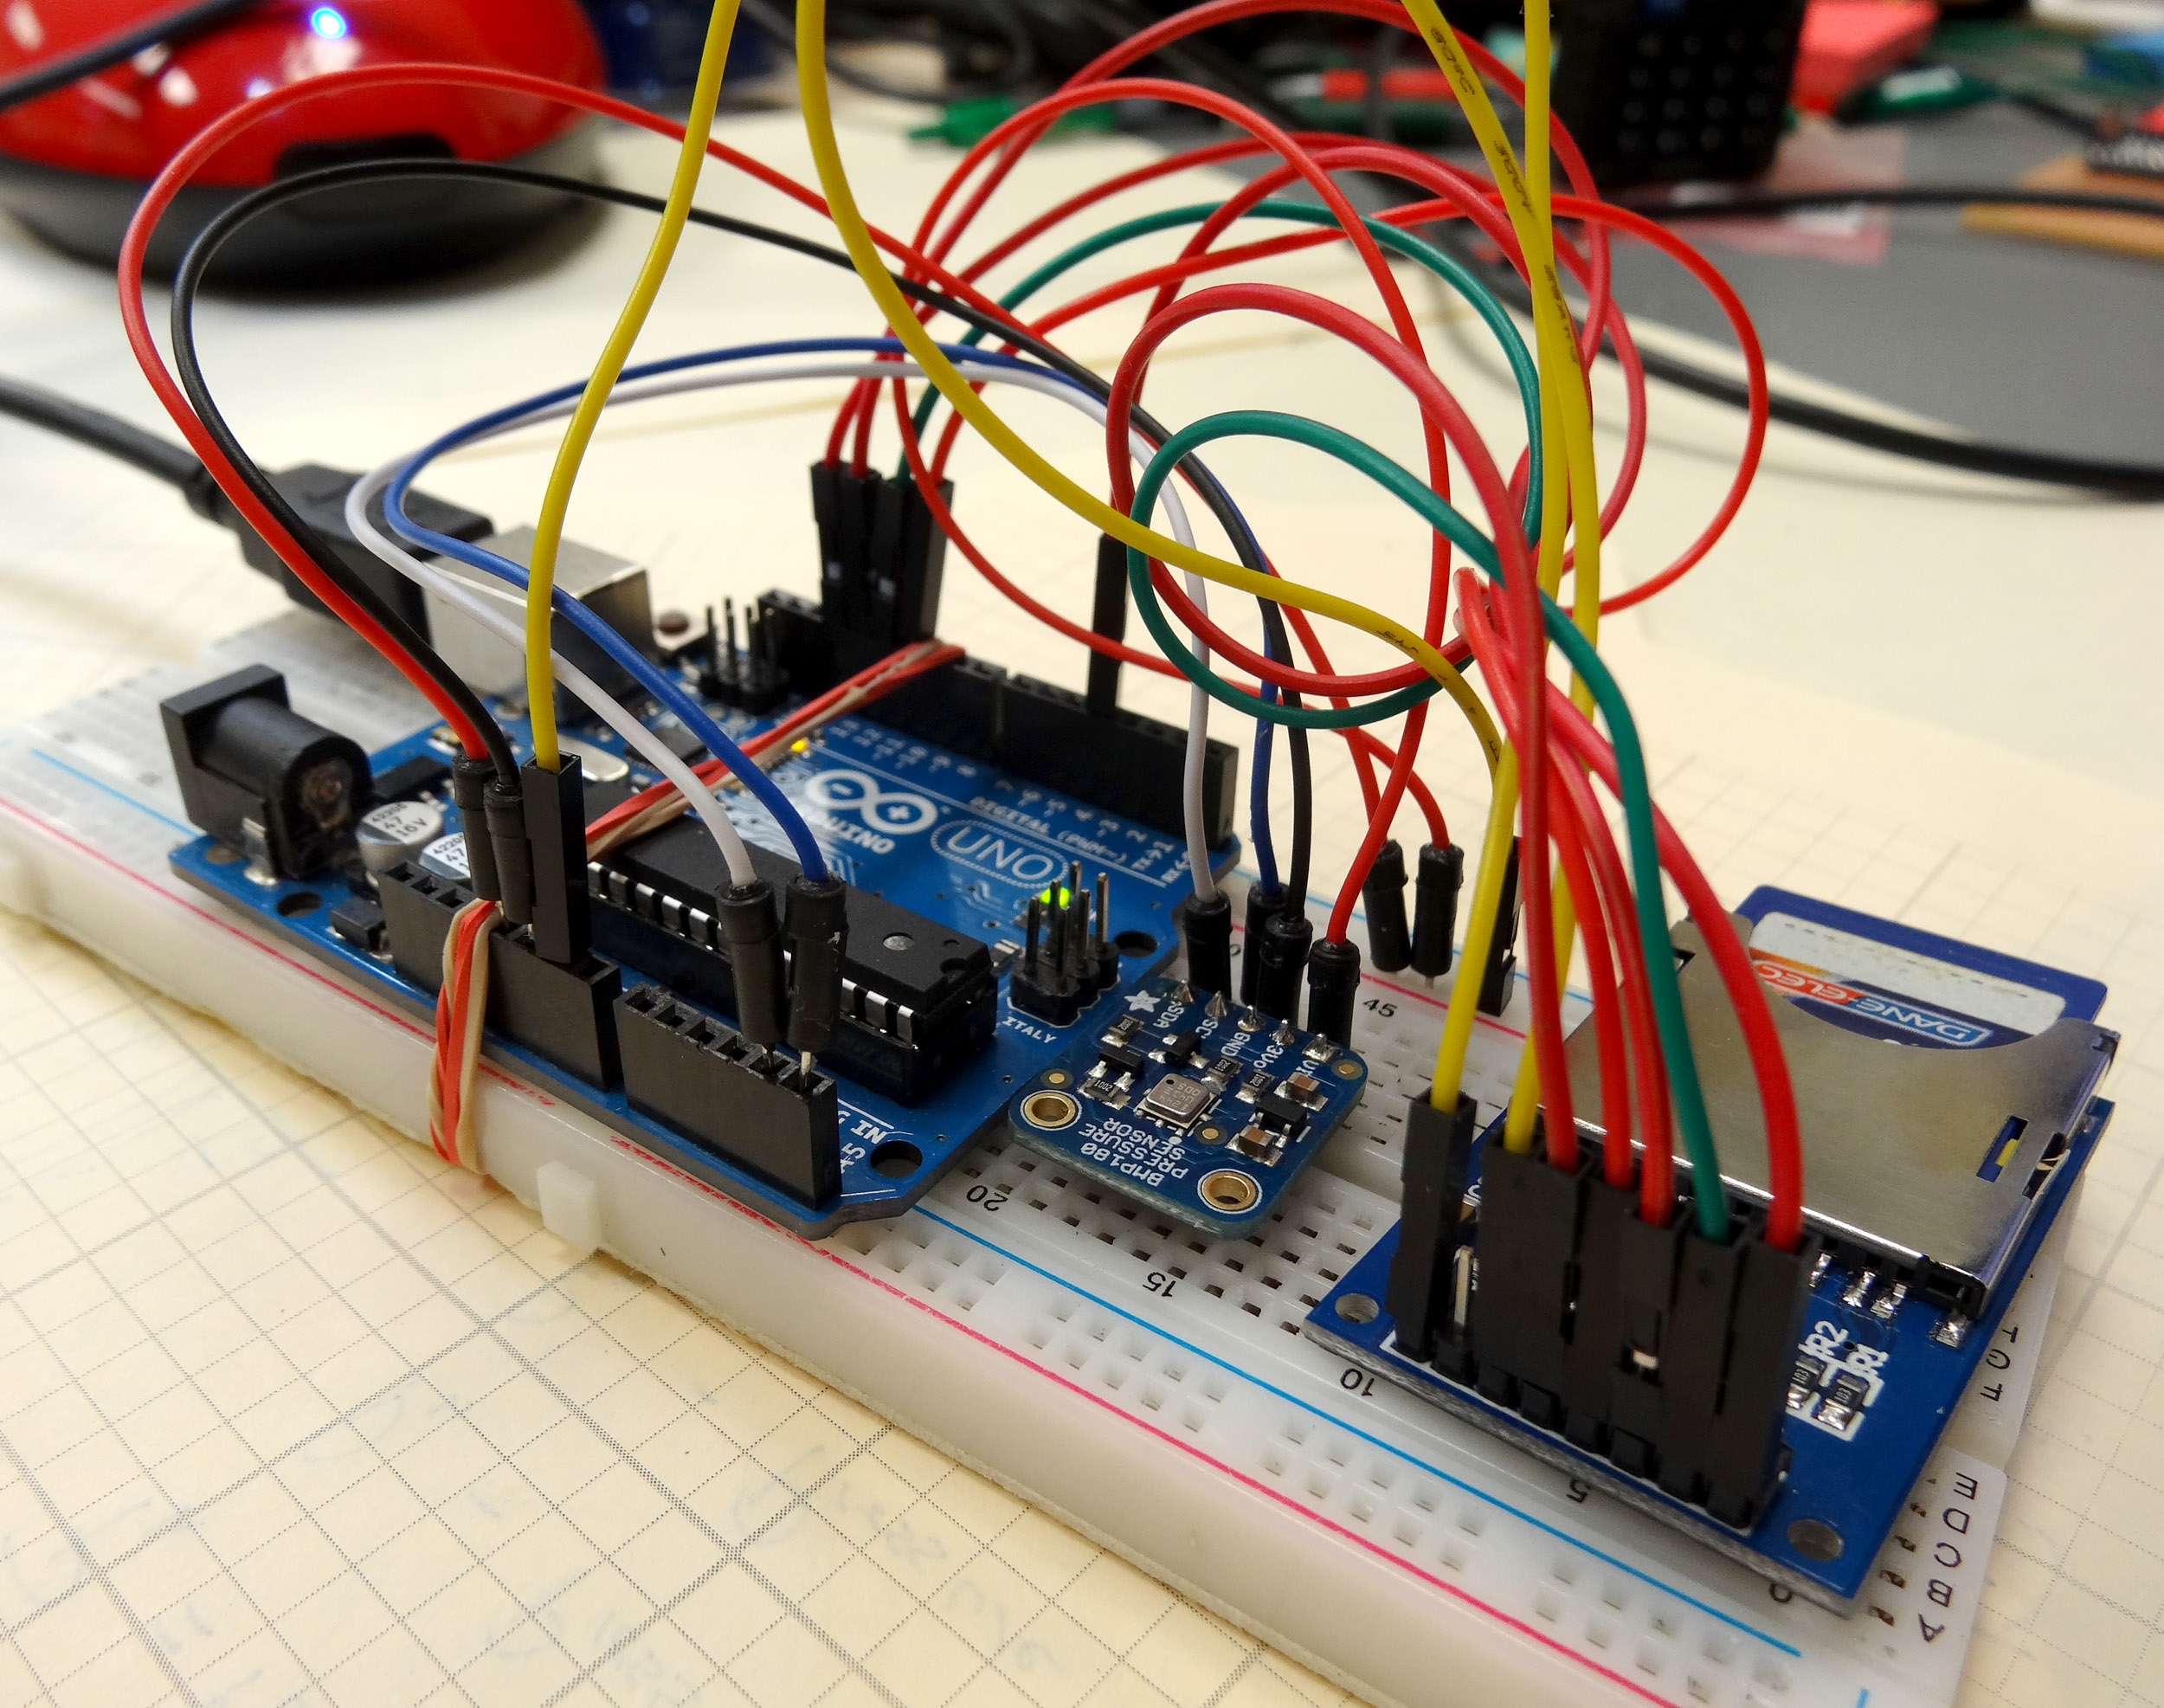
You also need to hook up the SC Card Reader/Writer. You should be familiar with this from lesson 21.
Connecting the SD Card Reader | ||
| Sd Card Reader Pin | Arduino Pin | Details |
| GND | GND | Common Ground |
| 3.3 V – (NOT USED) | ||
| +5 | 5V | Power |
| CS | 4 | Chip Select |
| MOSI | 11 | SPI Data |
| SCK | 13 | Clock |
| MISO | 12 | SPI Data |
| GND | GND | Common Ground |
Remember that this SD card reader has two rows of pins. Don’t let that confuse you, both rows are equivalent. You can connect to either row.
Most of the code has already been written in Lesson 22. In this lesson, the main thing we will be doing is to write the GPS data to the SD card. This way, as we walk around outside, it will log our positions to the SD card. We will create two files. One will hold the raw NMEA sentences, and the other our location data, as parsed by the adafruit GPS library. You should be able to figure most of this out from what you already know from lesson 22 and lesson 21. In the video above, we take you through this code step-by-step, so watch the video to understand what we are doing. If you get stuck, you can look at the code below.
1 2 3 4 5 6 7 8 9 10 11 12 13 14 15 16 17 18 19 20 21 22 23 24 25 26 27 28 29 30 31 32 33 34 35 36 37 38 39 40 41 42 43 44 45 46 47 48 49 50 51 52 53 54 55 56 57 58 59 60 61 62 63 64 65 66 67 68 69 70 71 72 73 74 75 76 77 78 79 80 81 82 83 84 85 86 87 88 89 90 91 92 93 94 95 96 | #include <SD.h> //Load SD card library #include<SPI.h> //Load SPI Library #include <Adafruit_GPS.h> //Install the adafruit GPS library #include <SoftwareSerial.h> //Load the Software Serial library SoftwareSerial mySerial(3,2); //Initialize the Software Serial port Adafruit_GPS GPS(&mySerial); //Create the GPS Object String NMEA1; //Variable for first NMEA sentence String NMEA2; //Variable for second NMEA sentence char c; //to read characters coming from the GPS int chipSelect = 4; //chipSelect pin for the SD card Reader File mySensorData; //Data object you will write your sesnor data to void setup() { Serial.begin(115200); //Turn on serial monitor GPS.begin(9600); //Turn on GPS at 9600 baud GPS.sendCommand("$PGCMD,33,0*6D"); //Turn off antenna update nuisance data GPS.sendCommand(PMTK_SET_NMEA_OUTPUT_RMCGGA); //Request RMC and GGA Sentences only GPS.sendCommand(PMTK_SET_NMEA_UPDATE_1HZ); //Set update rate to 1 hz delay(1000); pinMode(10, OUTPUT); //Must declare 10 an output and reserve it to keep SD card happy SD.begin(chipSelect); //Initialize the SD card reader if (SD.exists("NMEA.txt")) { //Delete old data files to start fresh SD.remove("NMEA.txt"); } if (SD.exists("GPSData.txt")) { //Delete old data files to start fresh SD.remove("GPSData.txt"); } } void loop() { readGPS(); if(GPS.fix==1) { //Only save data if we have a fix mySensorData = SD.open("NMEA.txt", FILE_WRITE); //Open file on SD card for writing mySensorData.println(NMEA1); //Write first NMEA to SD card mySensorData.println(NMEA2); //Write Second NMEA to SD card mySensorData.close(); //Close the file mySensorData = SD.open("GPSData.txt", FILE_WRITE); mySensorData.print(GPS.latitude,4); //Write measured latitude to file mySensorData.print(GPS.lat); //Which hemisphere N or S mySensorData.print(","); mySensorData.print(GPS.longitude,4); //Write measured longitude to file mySensorData.print(GPS.lon); //Which Hemisphere E or W mySensorData.print(","); mySensorData.println(GPS.altitude); mySensorData.close(); } } void readGPS() { clearGPS(); while(!GPS.newNMEAreceived()) { //Loop until you have a good NMEA sentence c=GPS.read(); } GPS.parse(GPS.lastNMEA()); //Parse that last good NMEA sentence NMEA1=GPS.lastNMEA(); while(!GPS.newNMEAreceived()) { //Loop until you have a good NMEA sentence c=GPS.read(); } GPS.parse(GPS.lastNMEA()); //Parse that last good NMEA sentence NMEA2=GPS.lastNMEA(); Serial.println(NMEA1); Serial.println(NMEA2); Serial.println(""); } void clearGPS() { //Clear old and corrupt data from serial port while(!GPS.newNMEAreceived()) { //Loop until you have a good NMEA sentence c=GPS.read(); } GPS.parse(GPS.lastNMEA()); //Parse that last good NMEA sentence while(!GPS.newNMEAreceived()) { //Loop until you have a good NMEA sentence c=GPS.read(); } GPS.parse(GPS.lastNMEA()); //Parse that last good NMEA sentence while(!GPS.newNMEAreceived()) { //Loop until you have a good NMEA sentence c=GPS.read(); } GPS.parse(GPS.lastNMEA()); //Parse that last good NMEA sentence } |