
This lesson describes how to program the Xbee Series 1 radios. It will work with either the standard Series 1 (S1) or the Series 1 Pro models. The Pro radios are higher power and will give greater range, but they cost more. The radios are configured using X-CTU software, which can be downloaded here. The video gives step by step instructions on how to configure and use the radios to communicate wirelessly over the serial port. Lesson 14 gives information on the hardware needed. Lessons 1-13 sill show you how to communicate between Python and Arduino if you need to get caught up on basic serial communication and interfacing arduino and python. The techniques provided in the video above, however, should work for just about any arduino project where you want to communicate between two arduinos, an arduino and PC, or between two PCs.
Tag Archives: Python
Python with Arduino LESSON 13: Calculating Height from Pressure measurements from BMP180 Pressure Sensor.
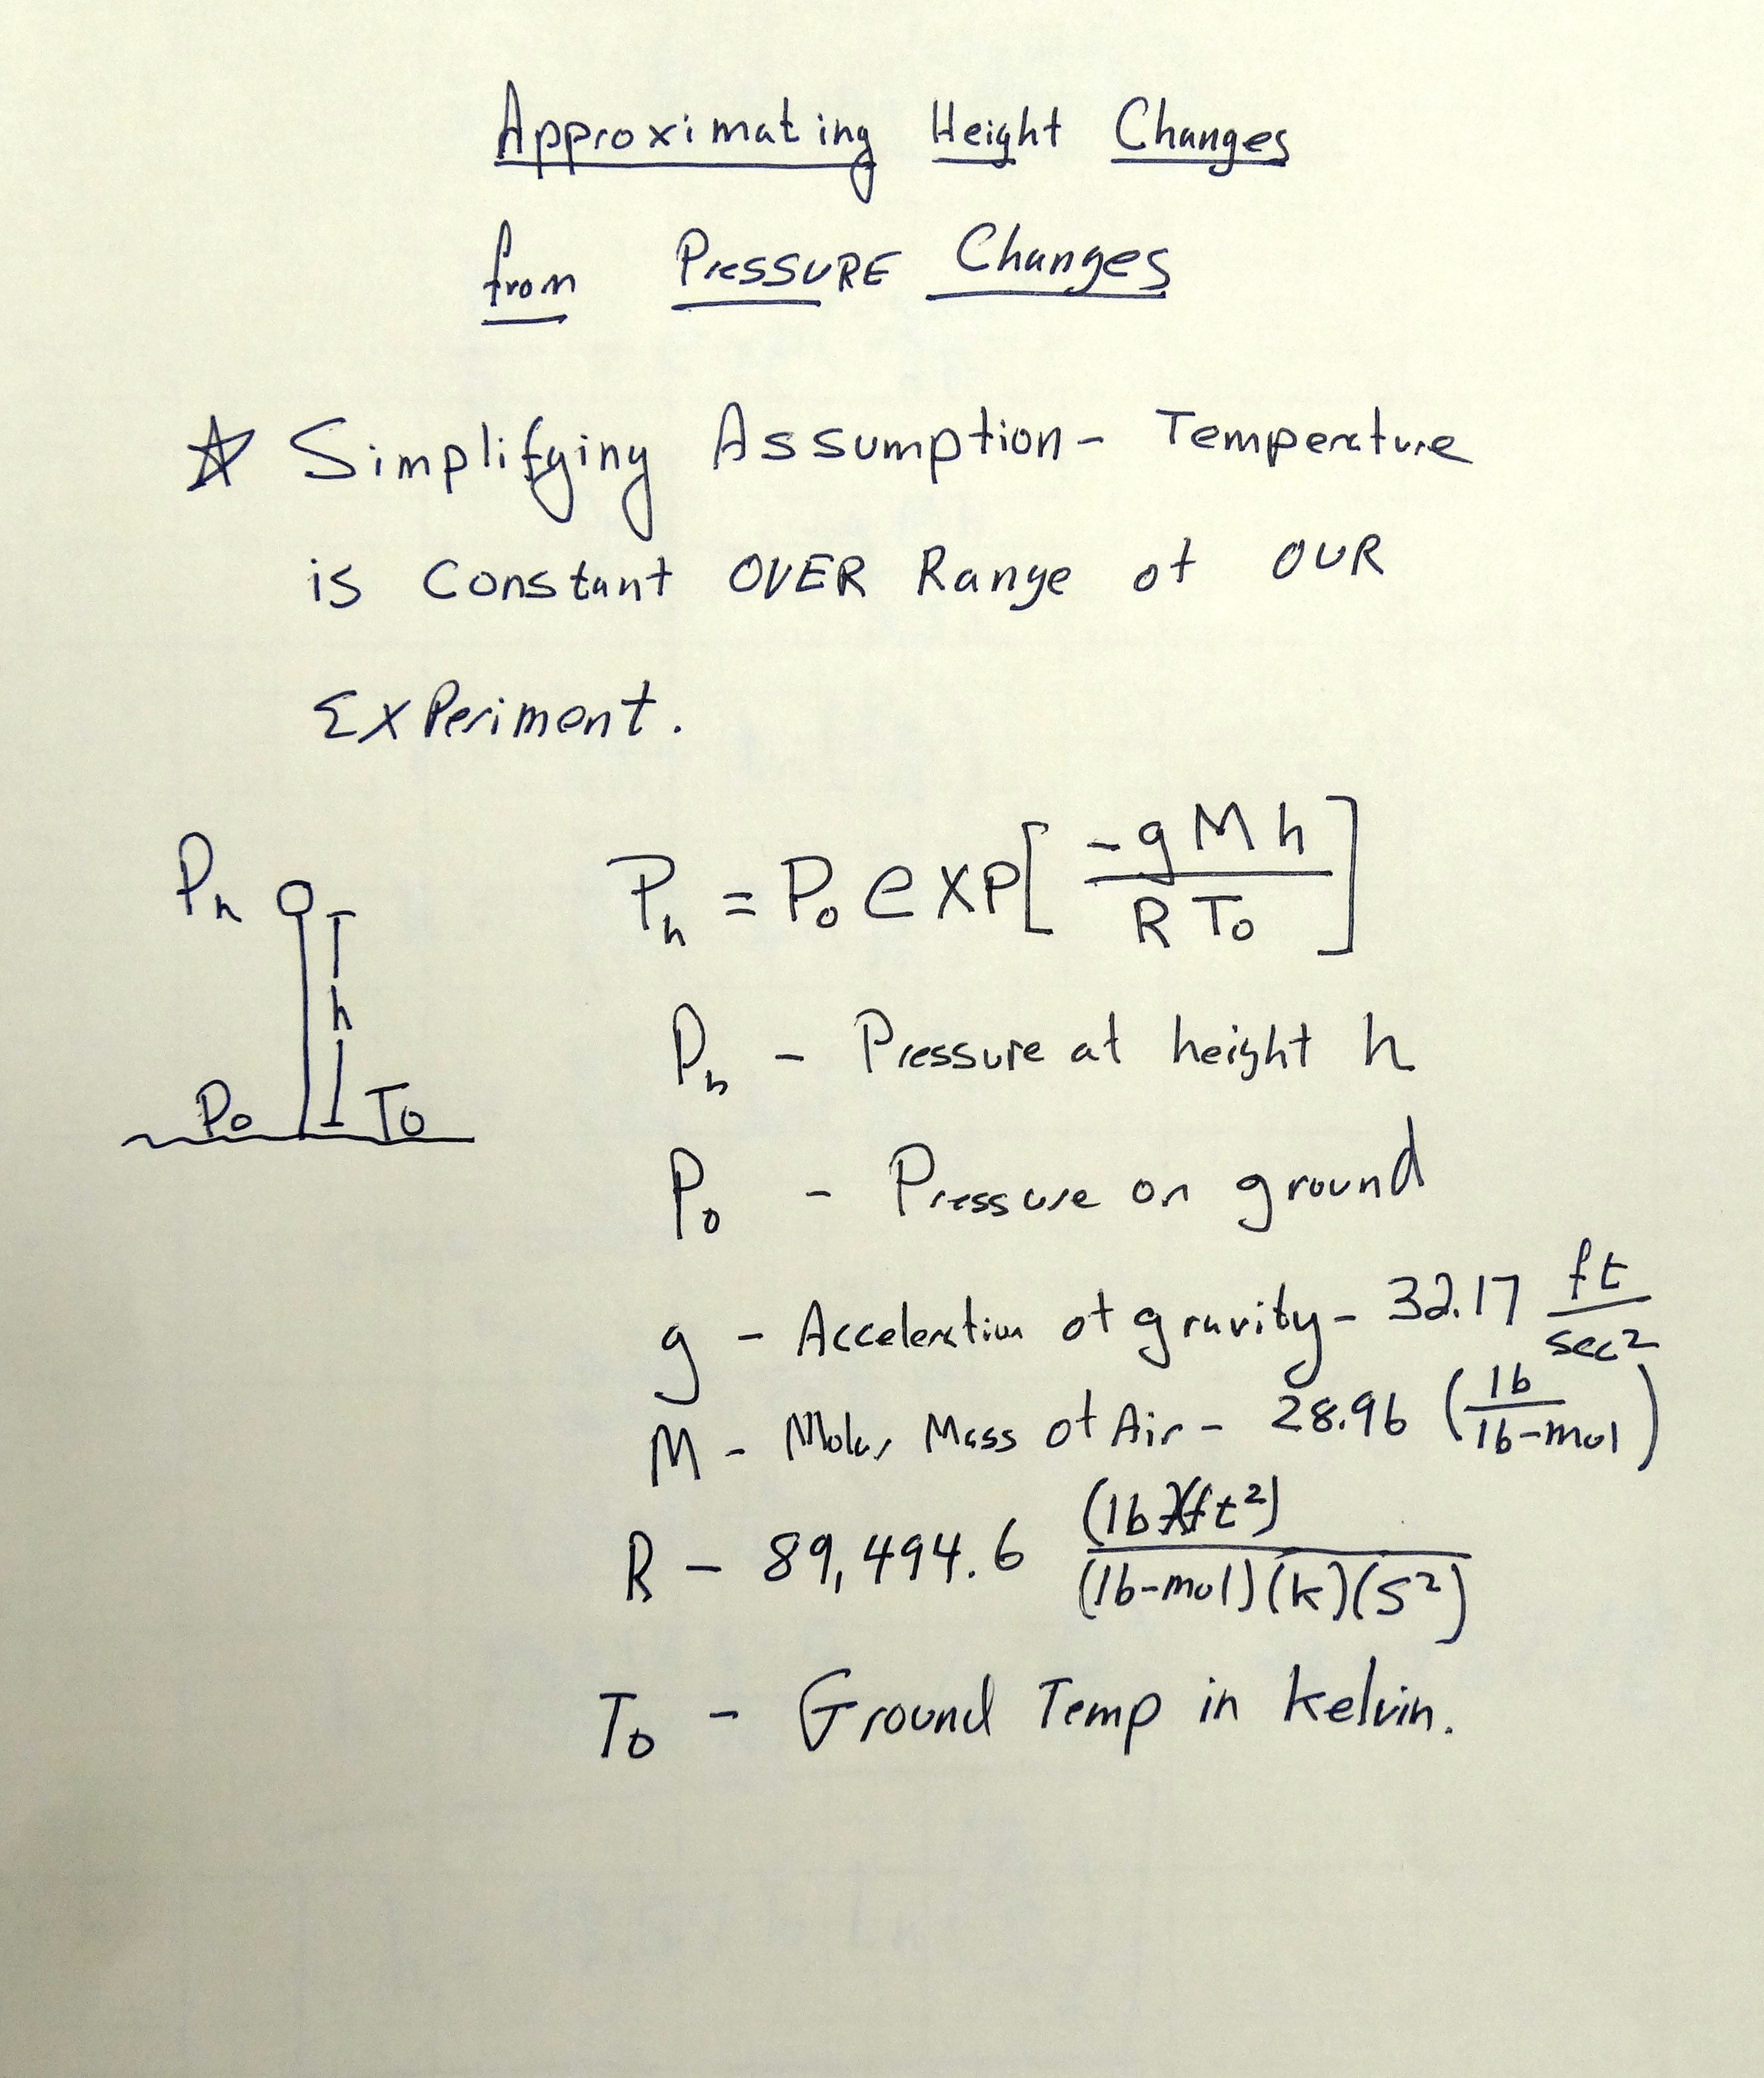
It is time to bring together a lot of things we have learned in our earlier lessons to create a Height-O-Meter, which will plot how high our BMP180 pressure sensor is above the floor. For this lesson we make simplifying assumption of constant temperature. When we use the sensor for our space probe or other high altitude experiments we will need to derive the equation again to take into account changing temperature. We went through the math of calculating height from changing pressure in LESSON 12.
In this lesson, we start with the software we developed in LESSON 11 for measuring, streaming, and plotting pressure and temperature data from the BMP180 sensor.
Remember, we connect the sensor to the Arduino as follows:
Connecting Up the BMP180 Pressure and Temperature Sensor | |
| BMP180 Pin | Arduino Pin |
| Vin | 5V |
| GND | GND |
| SCL | A5 |
| SDA | A4 |
The software we are using on the arduino side is shown below, from LESSON 11.
1 2 3 4 5 6 7 8 9 10 11 12 13 14 15 16 17 18 19 20 21 22 23 24 | #include "Wire.h" // imports the wire library for talking over I2C #include "Adafruit_BMP085.h" // import the Pressure Sensor Library Adafruit_BMP085 mySensor; // create sensor object called mySensor float tempC; // Variable for holding temp in C float tempF; // Variable for holding temp in F float pressure; //Variable for holding pressure reading void setup(){ Serial.begin(115200); //turn on serial monitor mySensor.begin(); //initialize mySensor } void loop() { tempC = mySensor.readTemperature(); // Be sure to declare your variables tempF = tempC*1.8 + 32.; // Convert degrees C to F pressure=mySensor.readPressure(); //Read Pressure Serial.print(tempF); Serial.print(" , "); Serial.println(pressure); delay(250); //Pause between readings. } |
We modify the Python code from LESSON 11 as explained in the video above to get this code for the Python side.
1 2 3 4 5 6 7 8 9 10 11 12 13 14 15 16 17 18 19 20 21 22 23 24 25 26 27 28 29 30 31 32 33 34 35 36 37 38 39 40 41 42 43 44 45 46 47 48 49 50 51 52 53 54 55 56 57 58 59 60 61 62 63 64 65 66 67 68 69 70 71 72 73 74 75 76 77 78 79 | import serial # import Serial Library import numpy as np # Import numpy import matplotlib.pyplot as plt #import matplotlib library from drawnow import * import time tempF= [] #Array for our Temperature dat pressure=[] #Array for our Pressure Data ht=[] #Array for our calculated Heights arduinoData = serial.Serial('com11', 115200) #Creating our serial object named arduinoData plt.ion() #Tell matplotlib you want interactive mode to plot live data cnt=0 def makeFig(): #Create a function that makes our desired plot plt.ylim(0,10) #Set y min and max values plt.title('My SuperCool Height-O-Meter') #Plot the title plt.grid(True) #Turn the grid on plt.ylabel('Height in Feet') #Set ylabels plt.plot(ht, 'ro-', label='Height') #plot the height array plt.legend(loc='upper left') #plot the legend plt2=plt.twinx() #Create a second y axis plt.ylim(75,85) #Set limits of second y axis- adjust to readings you are getting plt2.plot(tempF, 'b^-', label='tempF') #plot temperature array plt2.set_ylabel('temp F') #label second y axis plt2.ticklabel_format(useOffset=False) #Force matplotlib to NOT autoscale y axis plt2.legend(loc='upper right') #plot the legend tempBucket = 0 #Create bucket to hold sum of temperature readings PBucket=0 #Create bucket to hold sum of pressure readings print "PLease put Sensor Circuit on Ground for Calibration" #Calibrate sensor for readings on floor, P0 print "5" #Give user time to put sensor on floor time.sleep(1) print "4" time.sleep(1) print "3" time.sleep(1) print "2" time.sleep(1) print "1" time.sleep(1) print "Calibrating Sensor . . ." for i in np.arange(1,11,1): #Loop ten times to take ten measurements while (arduinoData.inWaiting()==0): #Wait here until there is data pass #do nothing arduinoString = arduinoData.readline() #read the line of text from the serial port dataArray = arduinoString.split(',') #Split it into an array called dataArray temp = float( dataArray[0]) #Convert first element to floating number and put in temp P = float( dataArray[1]) #Convert second element to floating number and put in P print "P = ",P, " , Temp= ", temp tempBucket=tempBucket + temp PBucket = PBucket + P P0 = PBucket/10 #Calcualte average pressure on floor tempK = ((tempBucket/10)-32)/1.8 +273.15 #Calculate average temperature on floor in K print "Baseline Temp in K is: ", tempK #Print resulrs print "Baseline Pressure inPa. : ", P0 while True: # While loop that loops forever while (arduinoData.inWaiting()==0): #Wait here until there is data pass #do nothing arduinoString = arduinoData.readline() #read the line of text from the serial port dataArray = arduinoString.split(',') #Split it into an array called dataArray temp = float( dataArray[0]) #Convert first element to floating number and put in temp P = float( dataArray[1]) #Convert second element to floating number and put in P h=98.57*tempK*np.log(P0/P) ht.append(h) tempF.append(temp) #Build our tempF array by appending temp readings pressure.append(P) #Building our pressure array by appending P readings drawnow(makeFig) #Call drawnow to update our live graph plt.pause(.000001) #Pause Briefly. Important to keep drawnow from crashing cnt=cnt+1 if(cnt>50): #If you have 50 or more points, delete the first one from the array tempF.pop(0) #This allows us to just see the last 50 data points pressure.pop(0) ht.pop(0) |
Please go through video for complete description of this software. Remember this is only valid for small changes in height over which temperature is constant.
Python with Arduino LESSON 12: Approximating Changes in Height from Changes in Pressure
In LESSON 9 we learned how to hook up a BMP180 Pressure Sensor and make pressure and temperature readings. Then in LESSON 11 we learned how to stream that data to Matplotlib and create live graphs and charts of our data that update in real time. We could see that as we moved the pressure sensor up and down, we could see the pressure change, as the pressure decreases with increasing elevation.
This leads to the interesting question of whether we can use our circuit developed in LESSON 9 to create a Height-O-Meter . . . a simple device that will measure the height above the floor.
The math to calculate altitude vs. pressure turns out to be very complex. Particularly, if we wanted something for our high altitude balloon flights, or for model rocketry. It turns out that for the case of measuring height inside and for relatively small changes in height we can make simplifying assumptions that make things much easier. The assumption we will make is that temperature does not change much over the range of our experiment. With this assumption, we can create our own Height-O-Meter. To do this though, we do need to to through some math. I show my math below, and go through it step-by-step in the video. Remember, this simplified approach is only valid for playing around with small changes in height. We will have to do the more complicated math when we make our high altitude balloon probe. For now though, this math will work pretty well.
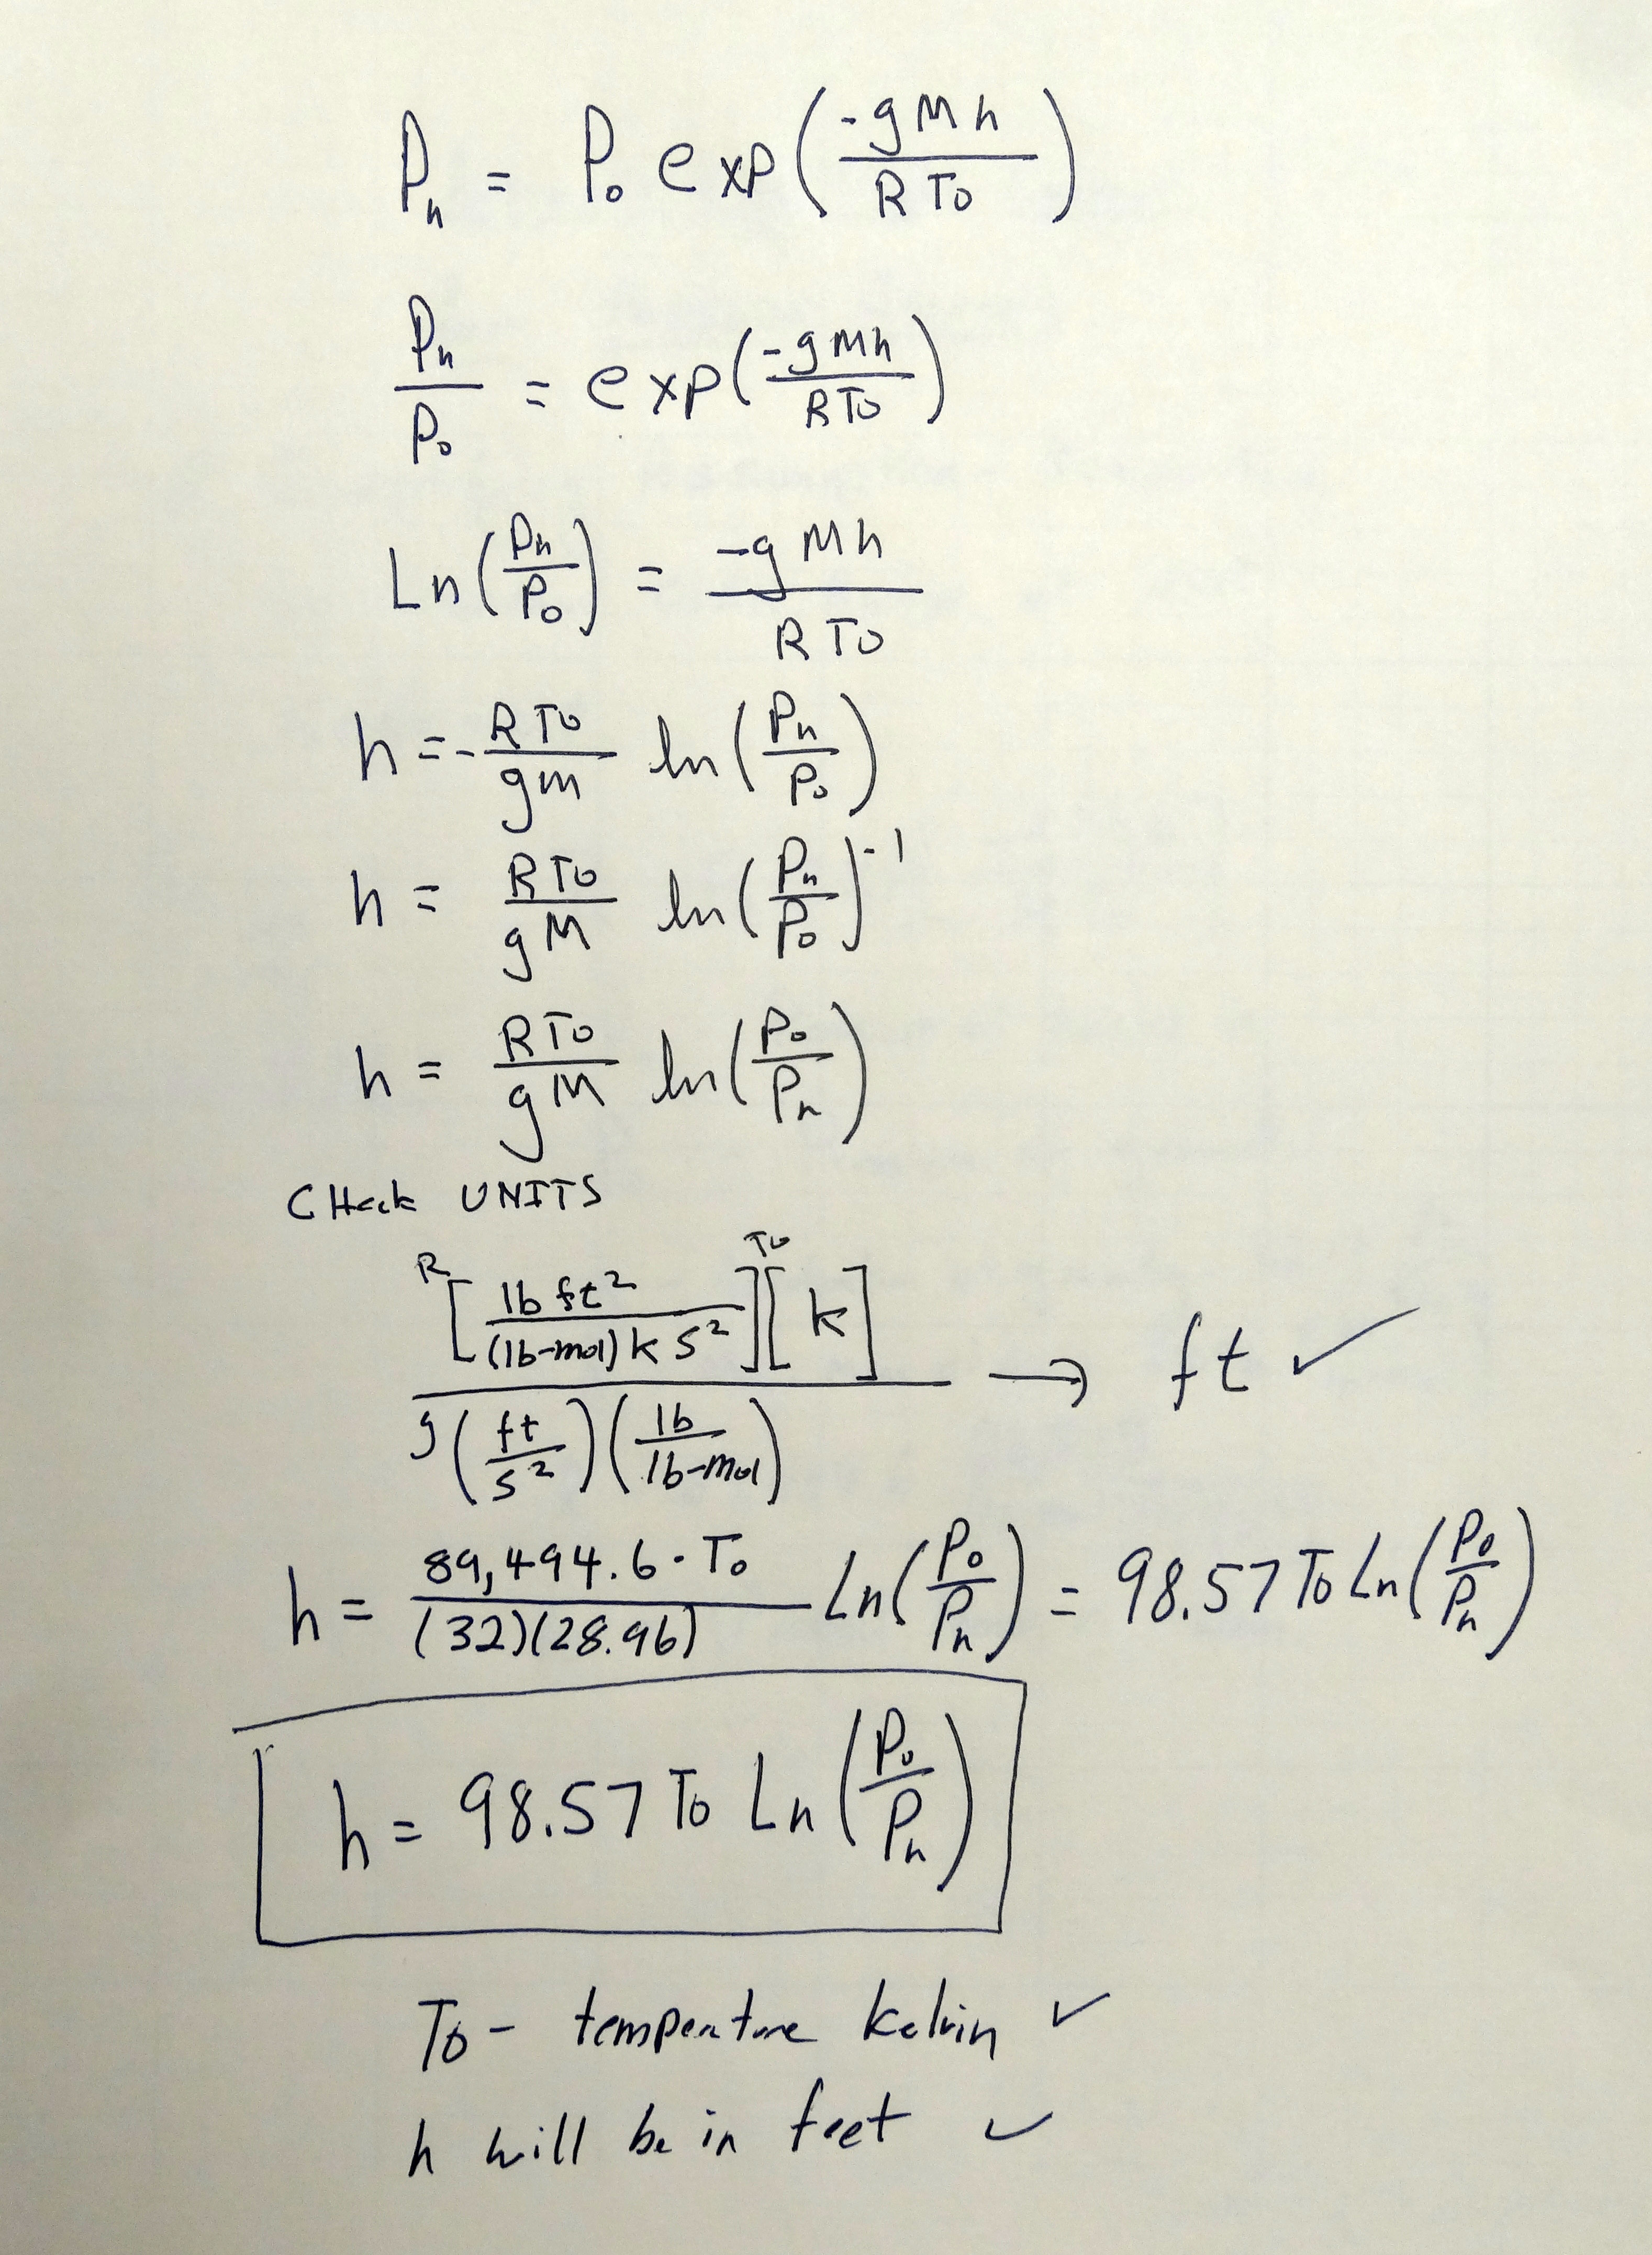
We can rearrange the equation to solve for height as a function of pressure.
Python with Arduino LESSON 11: Plotting and Graphing Live Data from Arduino with Matplotlib
We now have all the pieces put together to allow us to plot live data from the Arduino. If you have kept up with the earlier lessons, you will now have everything you need. If you have not done the earlier lessons, make sure you have python 2.7, vPython and pySerial installed from Python with Arduino LESSON 2. Make sure you have installed matplotlib (Python with Arduino LESSON 7), and install drawnow (Python with Arduino LESSON 10). Also, you need to build the BMP180 circuit and get the arduino programmed up as explained in Python with Arduino LESSON 9. With this business taken care of, you are now ready to start plotting live data.

We are using the Adafruit BMP180 pressure sensor. We showed how to hook it up and program it in LESSON 9. As a reminder, we are using this code for the arduino. LESSON 9 explained in detail how the code works.
1 2 3 4 5 6 7 8 9 10 11 12 13 14 15 16 17 18 19 20 21 22 23 24 | #include "Wire.h" // imports the wire library for talking over I2C #include "Adafruit_BMP085.h" // import the Pressure Sensor Library Adafruit_BMP085 mySensor; // create sensor object called mySensor float tempC; // Variable for holding temp in C float tempF; // Variable for holding temp in F float pressure; //Variable for holding pressure reading void setup(){ Serial.begin(115200); //turn on serial monitor mySensor.begin(); //initialize mySensor } void loop() { tempC = mySensor.readTemperature(); // Be sure to declare your variables tempF = tempC*1.8 + 32.; // Convert degrees C to F pressure=mySensor.readPressure(); //Read Pressure Serial.print(tempF); Serial.print(" , "); Serial.println(pressure); delay(250); //Pause between readings. } |
The video in this lesson above explains step-by-step how to develop the code on the Python side, and how matplotlib and drawnow work together to make live graphs and plots of data streaming from the arduino in real time. The code below is what we developed in the video. Do not simply cut and paste this code, but make sure that you understand it so you are able to create your own live graphing programs from scratch. If you are in my class, you will be required to be able to develop live graphing code like this from scratch, so don’t take a shortcut and copy and paste.
1 2 3 4 5 6 7 8 9 10 11 12 13 14 15 16 17 18 19 20 21 22 23 24 25 26 27 28 29 30 31 32 33 34 35 36 37 38 39 40 41 | import serial # import Serial Library import numpy # Import numpy import matplotlib.pyplot as plt #import matplotlib library from drawnow import * tempF= [] pressure=[] arduinoData = serial.Serial('com11', 115200) #Creating our serial object named arduinoData plt.ion() #Tell matplotlib you want interactive mode to plot live data cnt=0 def makeFig(): #Create a function that makes our desired plot plt.ylim(80,90) #Set y min and max values plt.title('My Live Streaming Sensor Data') #Plot the title plt.grid(True) #Turn the grid on plt.ylabel('Temp F') #Set ylabels plt.plot(tempF, 'ro-', label='Degrees F') #plot the temperature plt.legend(loc='upper left') #plot the legend plt2=plt.twinx() #Create a second y axis plt.ylim(93450,93525) #Set limits of second y axis- adjust to readings you are getting plt2.plot(pressure, 'b^-', label='Pressure (Pa)') #plot pressure data plt2.set_ylabel('Pressrue (Pa)') #label second y axis plt2.ticklabel_format(useOffset=False) #Force matplotlib to NOT autoscale y axis plt2.legend(loc='upper right') #plot the legend while True: # While loop that loops forever while (arduinoData.inWaiting()==0): #Wait here until there is data pass #do nothing arduinoString = arduinoData.readline() #read the line of text from the serial port dataArray = arduinoString.split(',') #Split it into an array called dataArray temp = float( dataArray[0]) #Convert first element to floating number and put in temp P = float( dataArray[1]) #Convert second element to floating number and put in P tempF.append(temp) #Build our tempF array by appending temp readings pressure.append(P) #Building our pressure array by appending P readings drawnow(makeFig) #Call drawnow to update our live graph plt.pause(.000001) #Pause Briefly. Important to keep drawnow from crashing cnt=cnt+1 if(cnt>50): #If you have 50 or more points, delete the first one from the array tempF.pop(0) #This allows us to just see the last 50 data points pressure.pop(0) |
You should be seeing data like the graph on the top of this lesson. You will probably need to adjust your y-axis scale parameters in Python to ensure the scale is suitable for the data you are taking. If your chart is blank, likely your y-scales are not right for your data measurements.
Python with Arduino LESSON 10: Installing Drawnow to Allow Live Plotting with Matplotlib
Our objective with this series of lessons is to plot live data coming from arduino using Python and Matplotlib. We have taken a few lessons to get familiar with Matplotlib, and we have built a circuit to stream live data from arduino to python. We need to install one more library to enable Matplotlib to plot live sensor data in real time. The magic library is called drawnow. The bad news is that this library is hard to install on windows. The good news it that PIP installs it very easy. So, if you have not done so already, you need to go to Python with Arduino LESSON 6 and install PIP. PIP makes it very easy to install drawnow.