Tag Archives: Color Sensor

Python with Arduino LESSON 5: Finishing our Virtual Reality Example

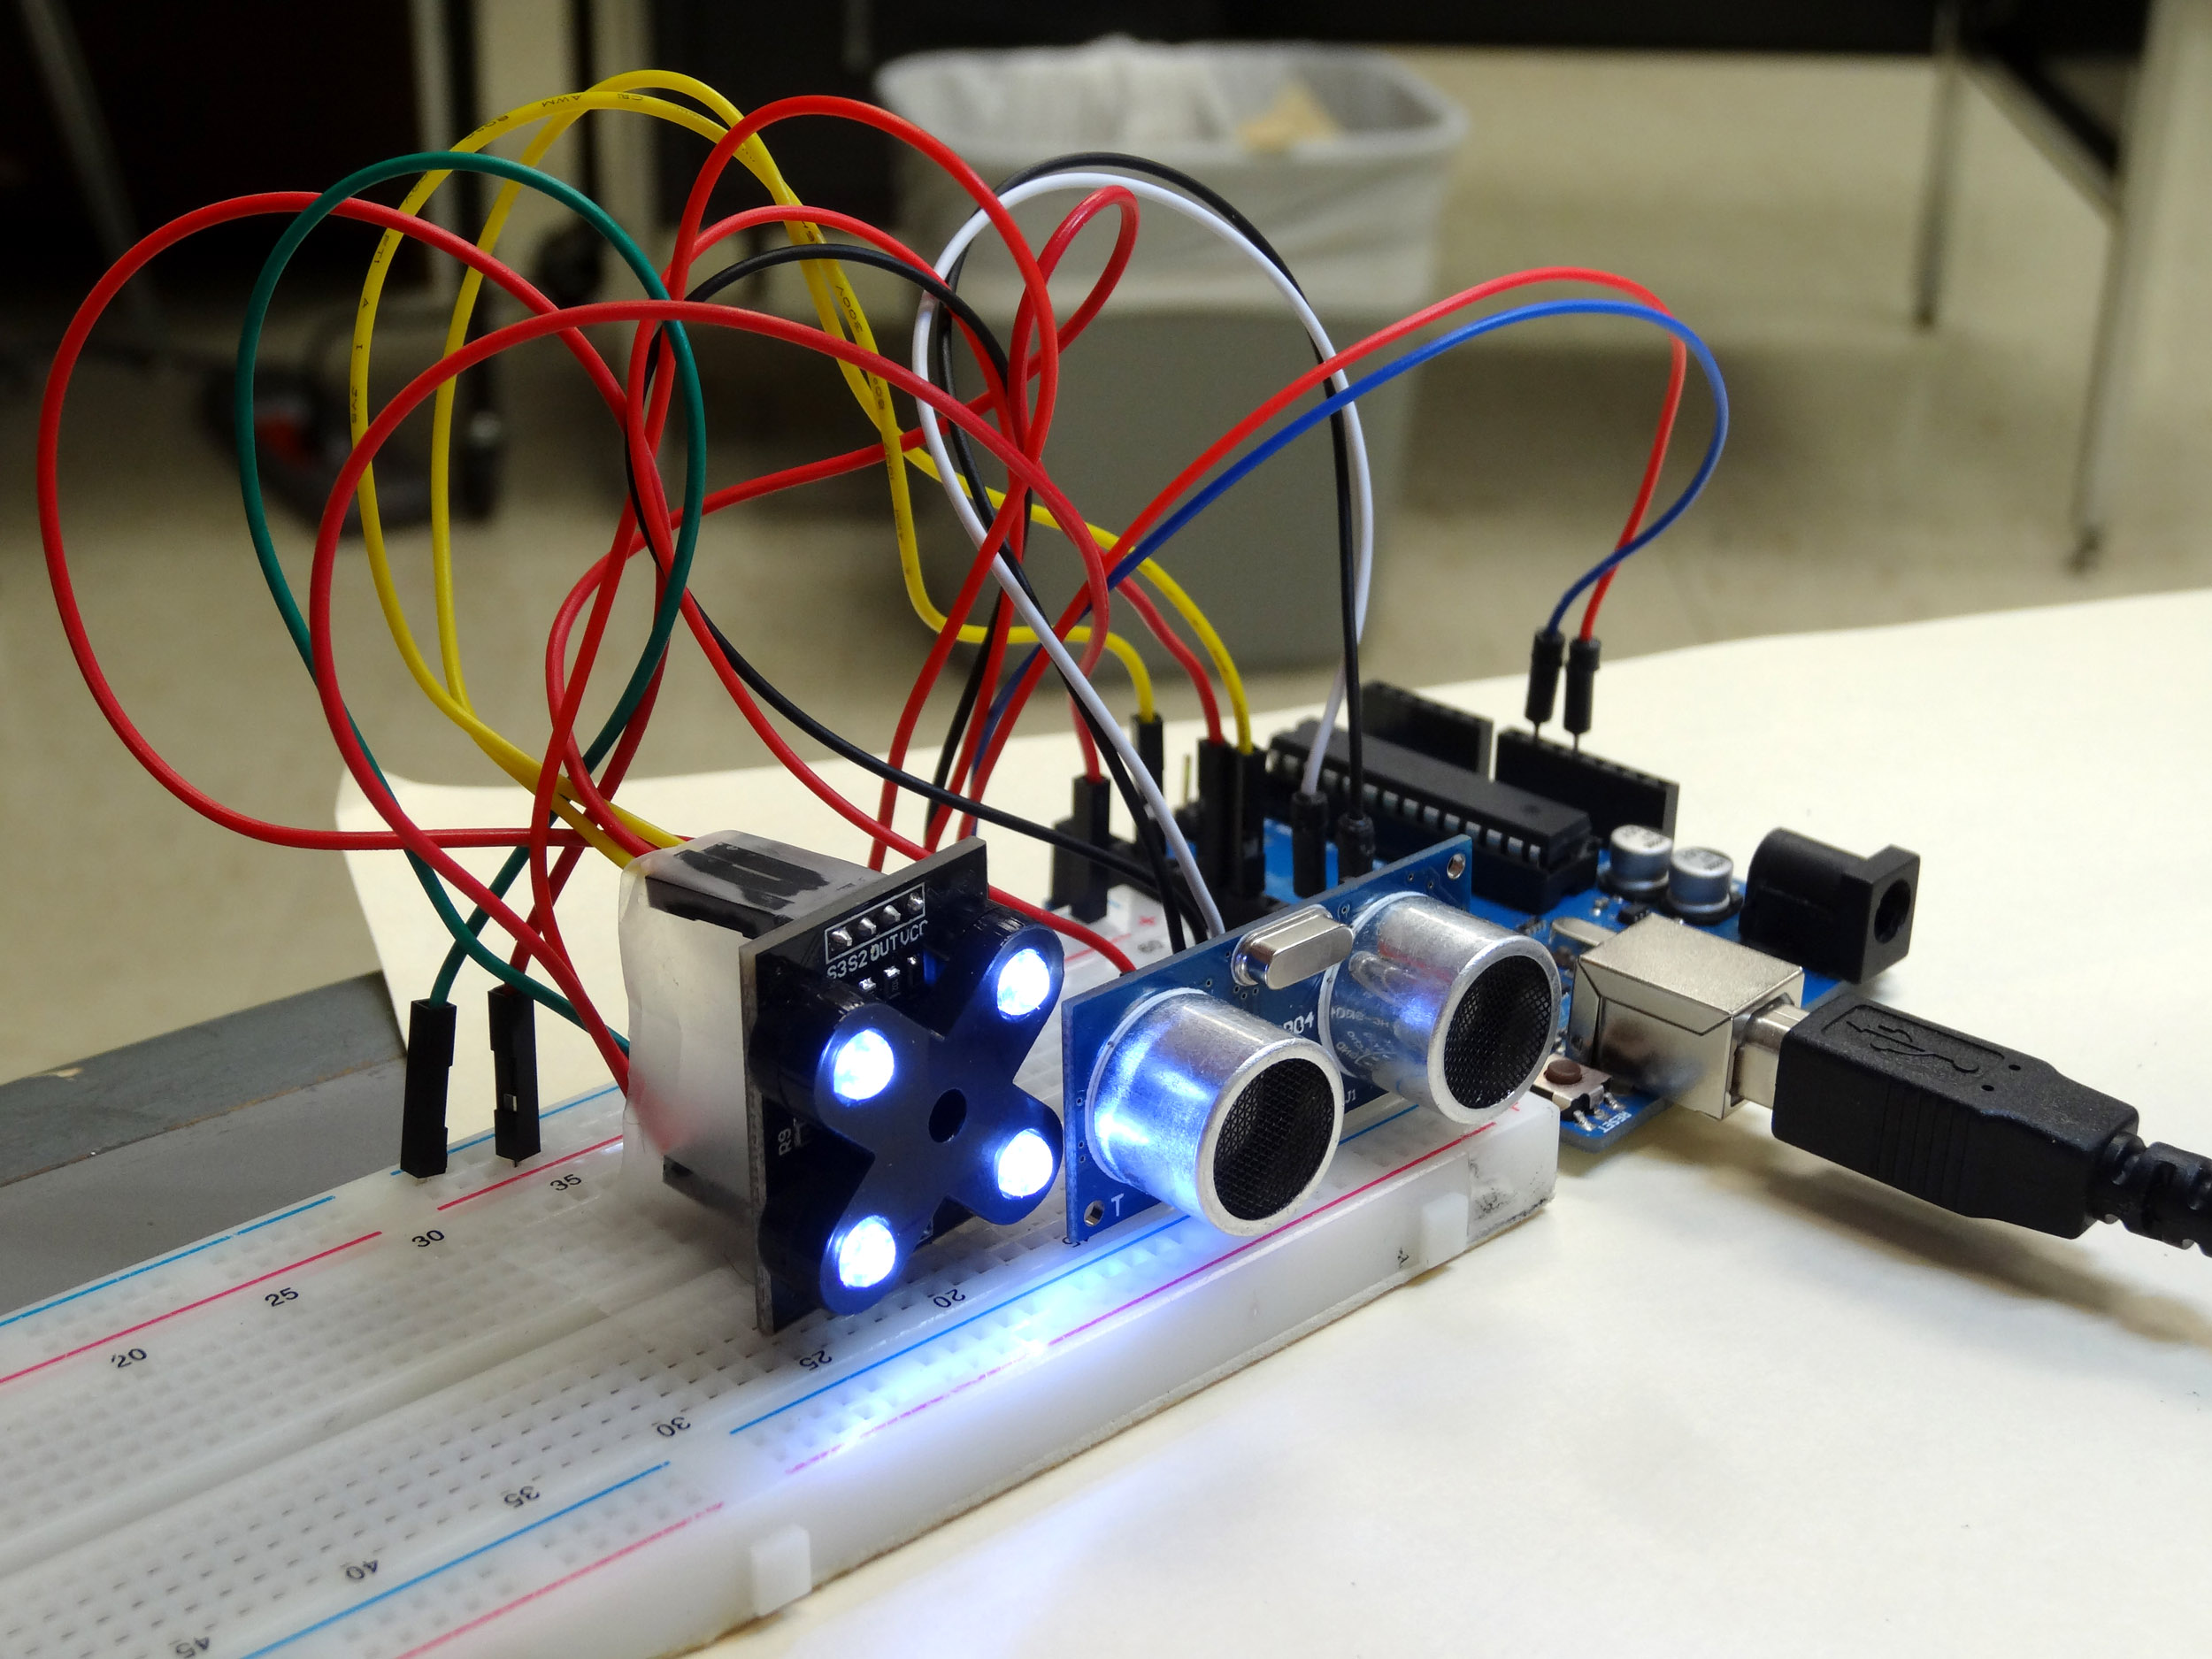
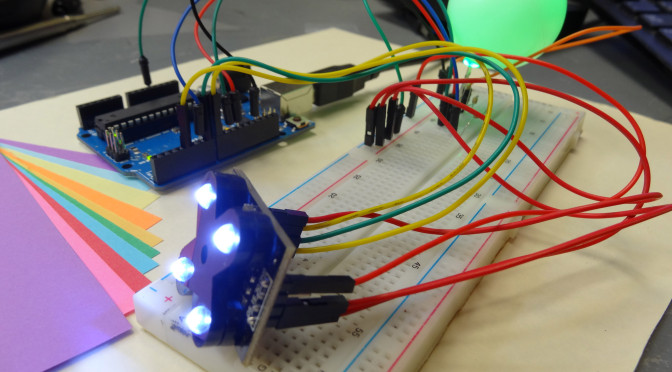
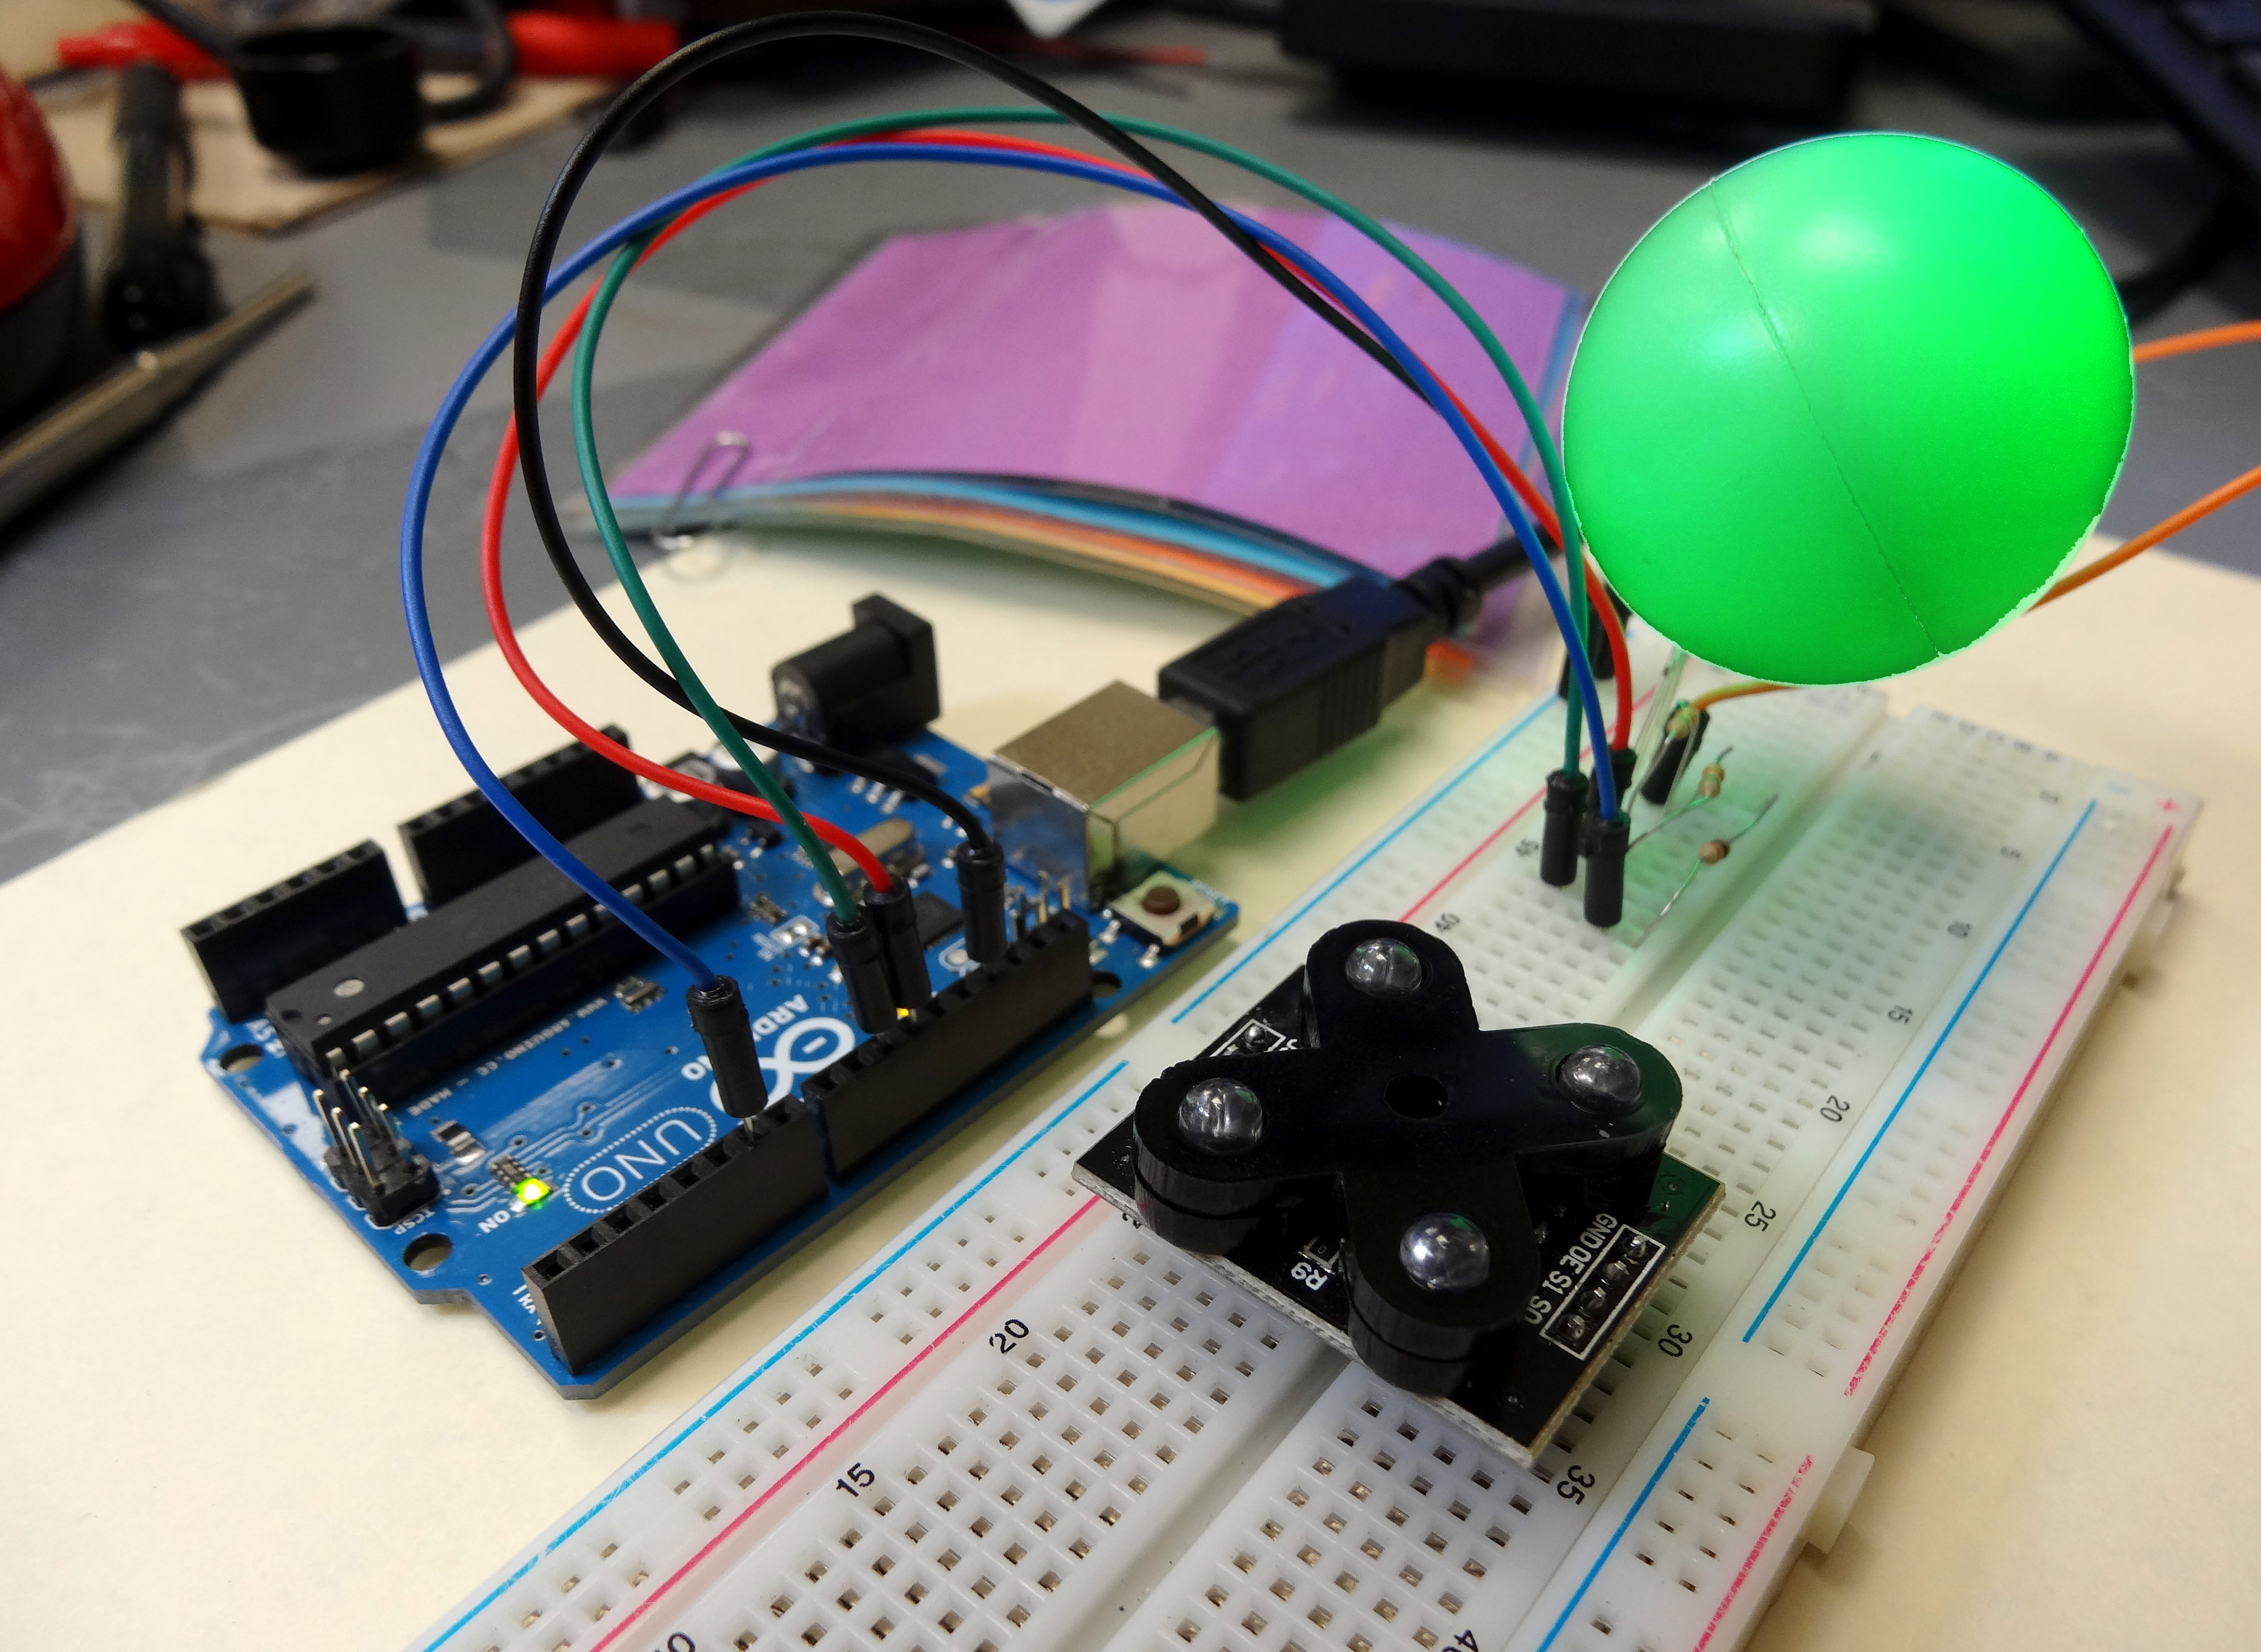
This Lesson finishes the work that was begun in Python with Arduino LESSON 4. In that lesson we built the circuit and programmed the arduino to measure the distance to a target and the color of the target. The program then output that data to the serial port. In today’s lesson we will use python to read that data stream, and use the data to dynamically update a virtual world we create.

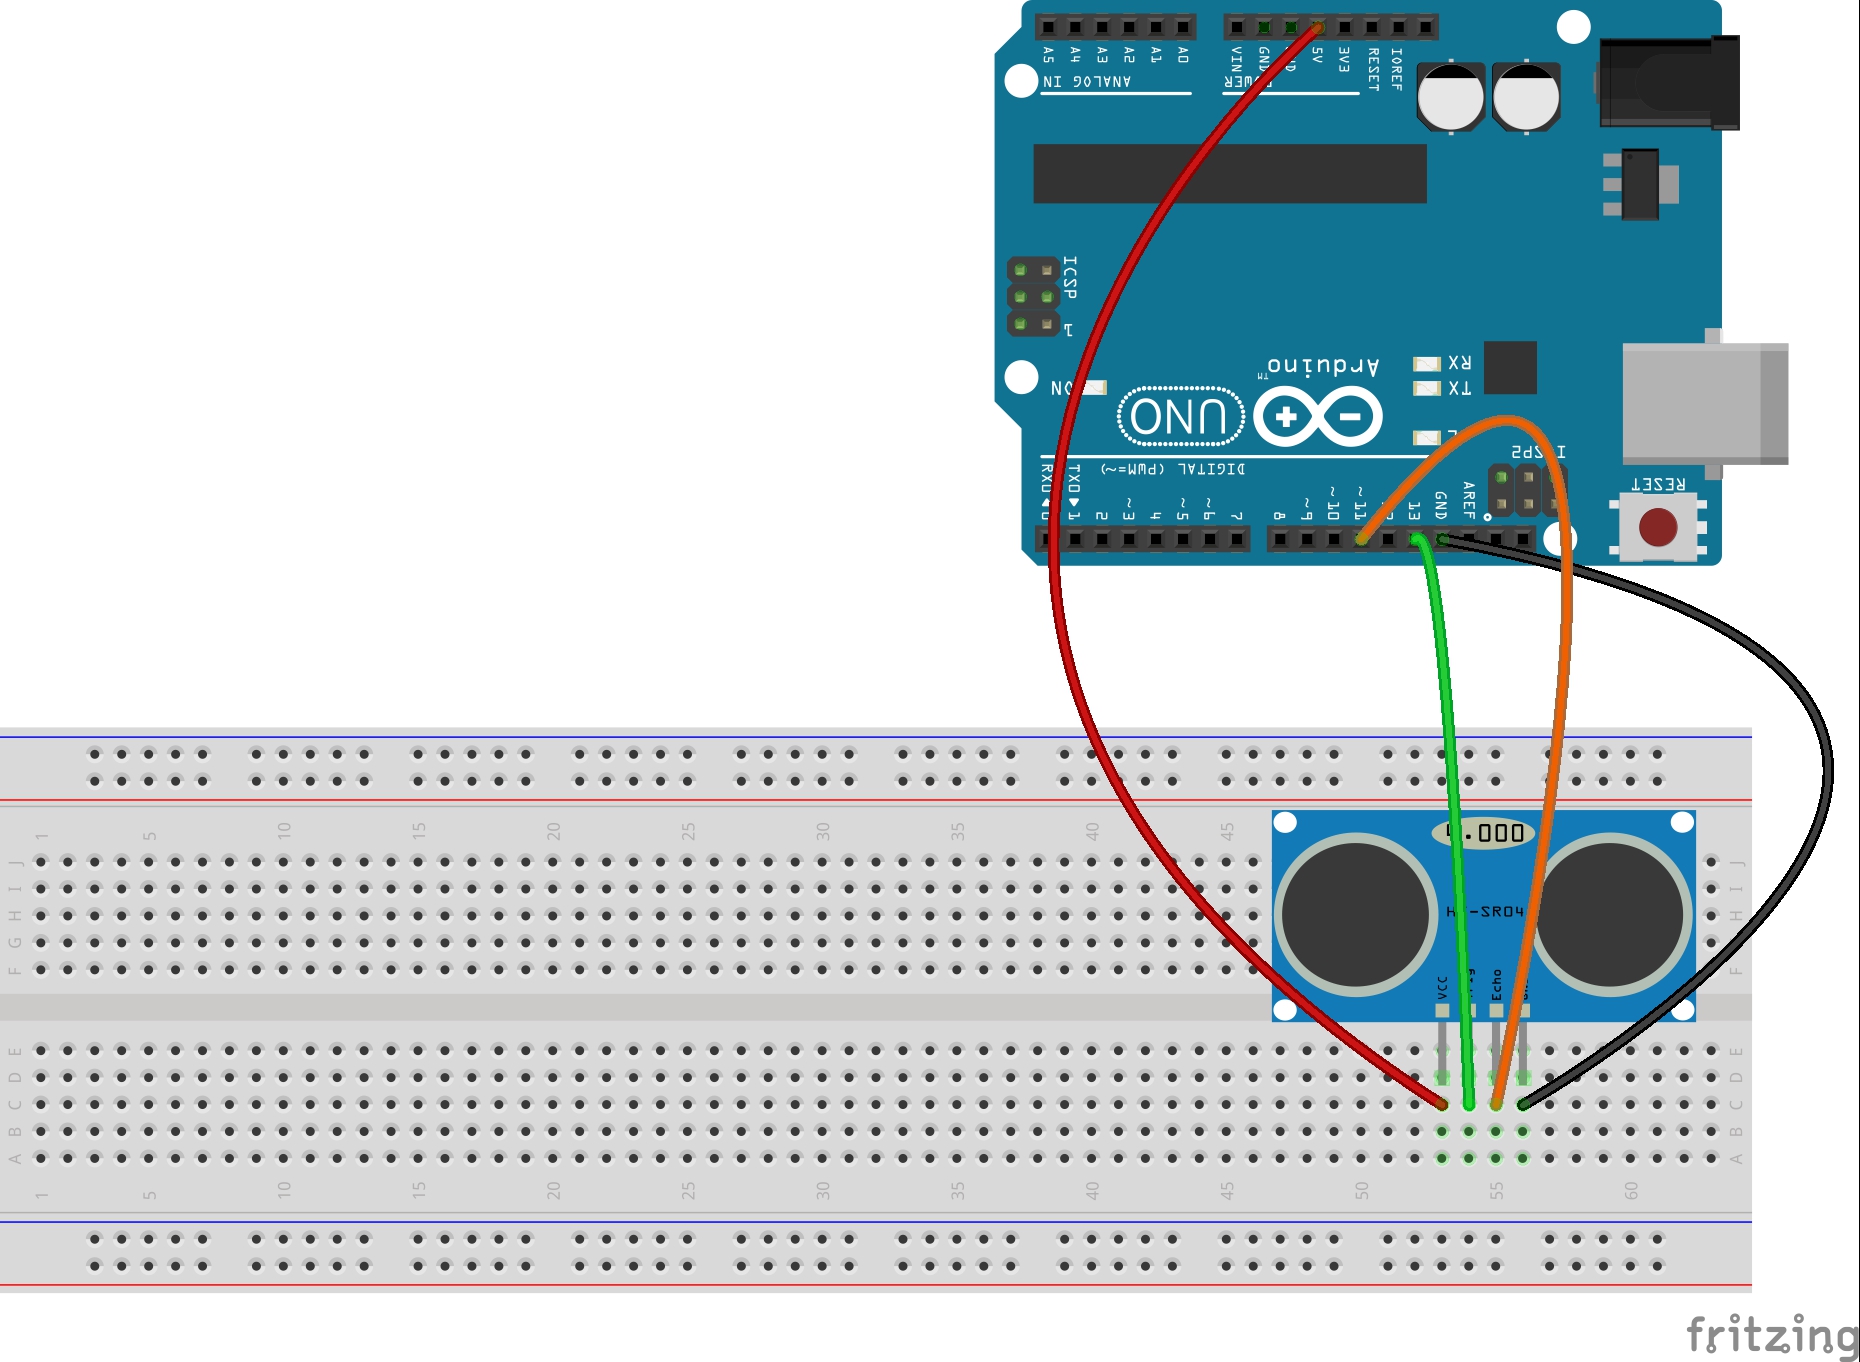
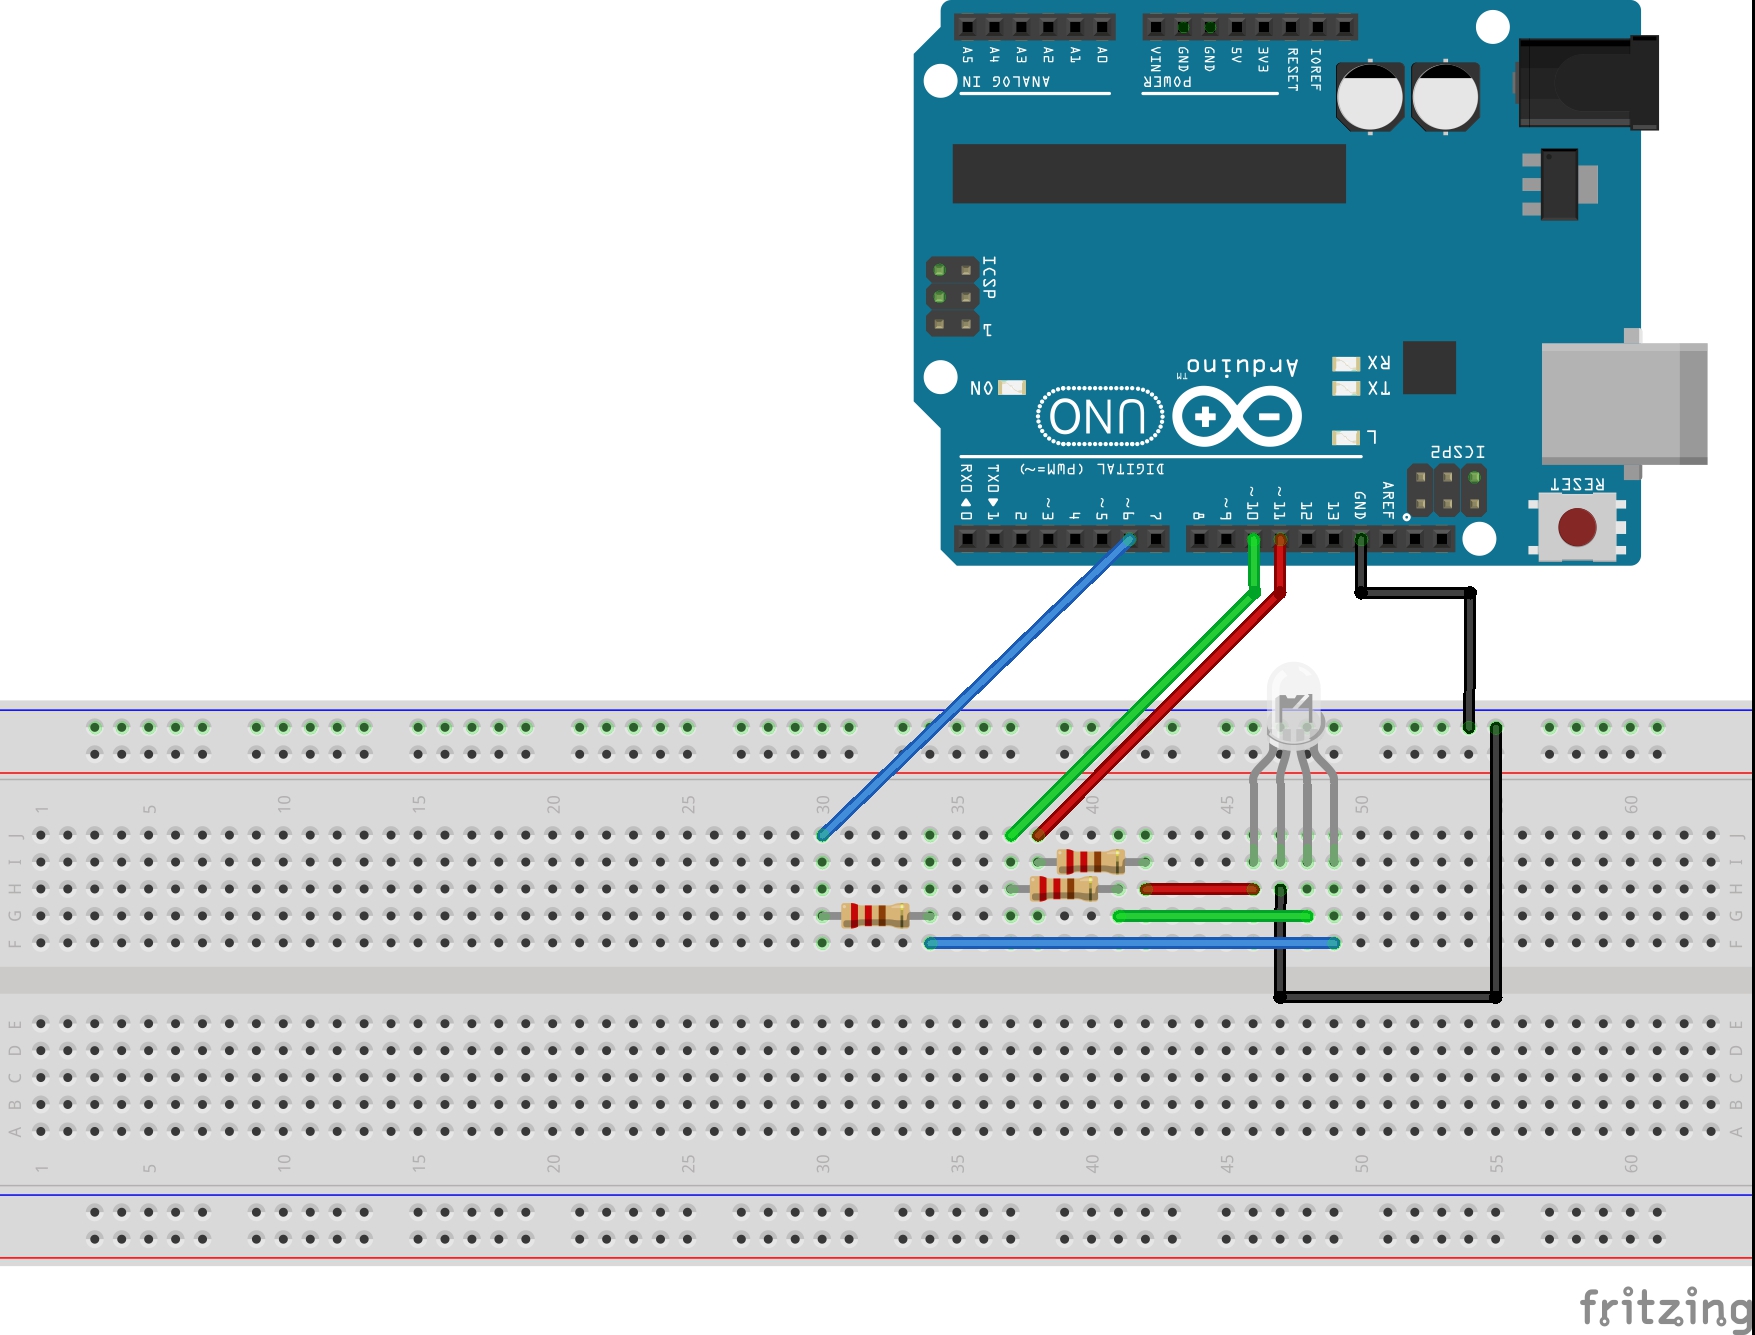
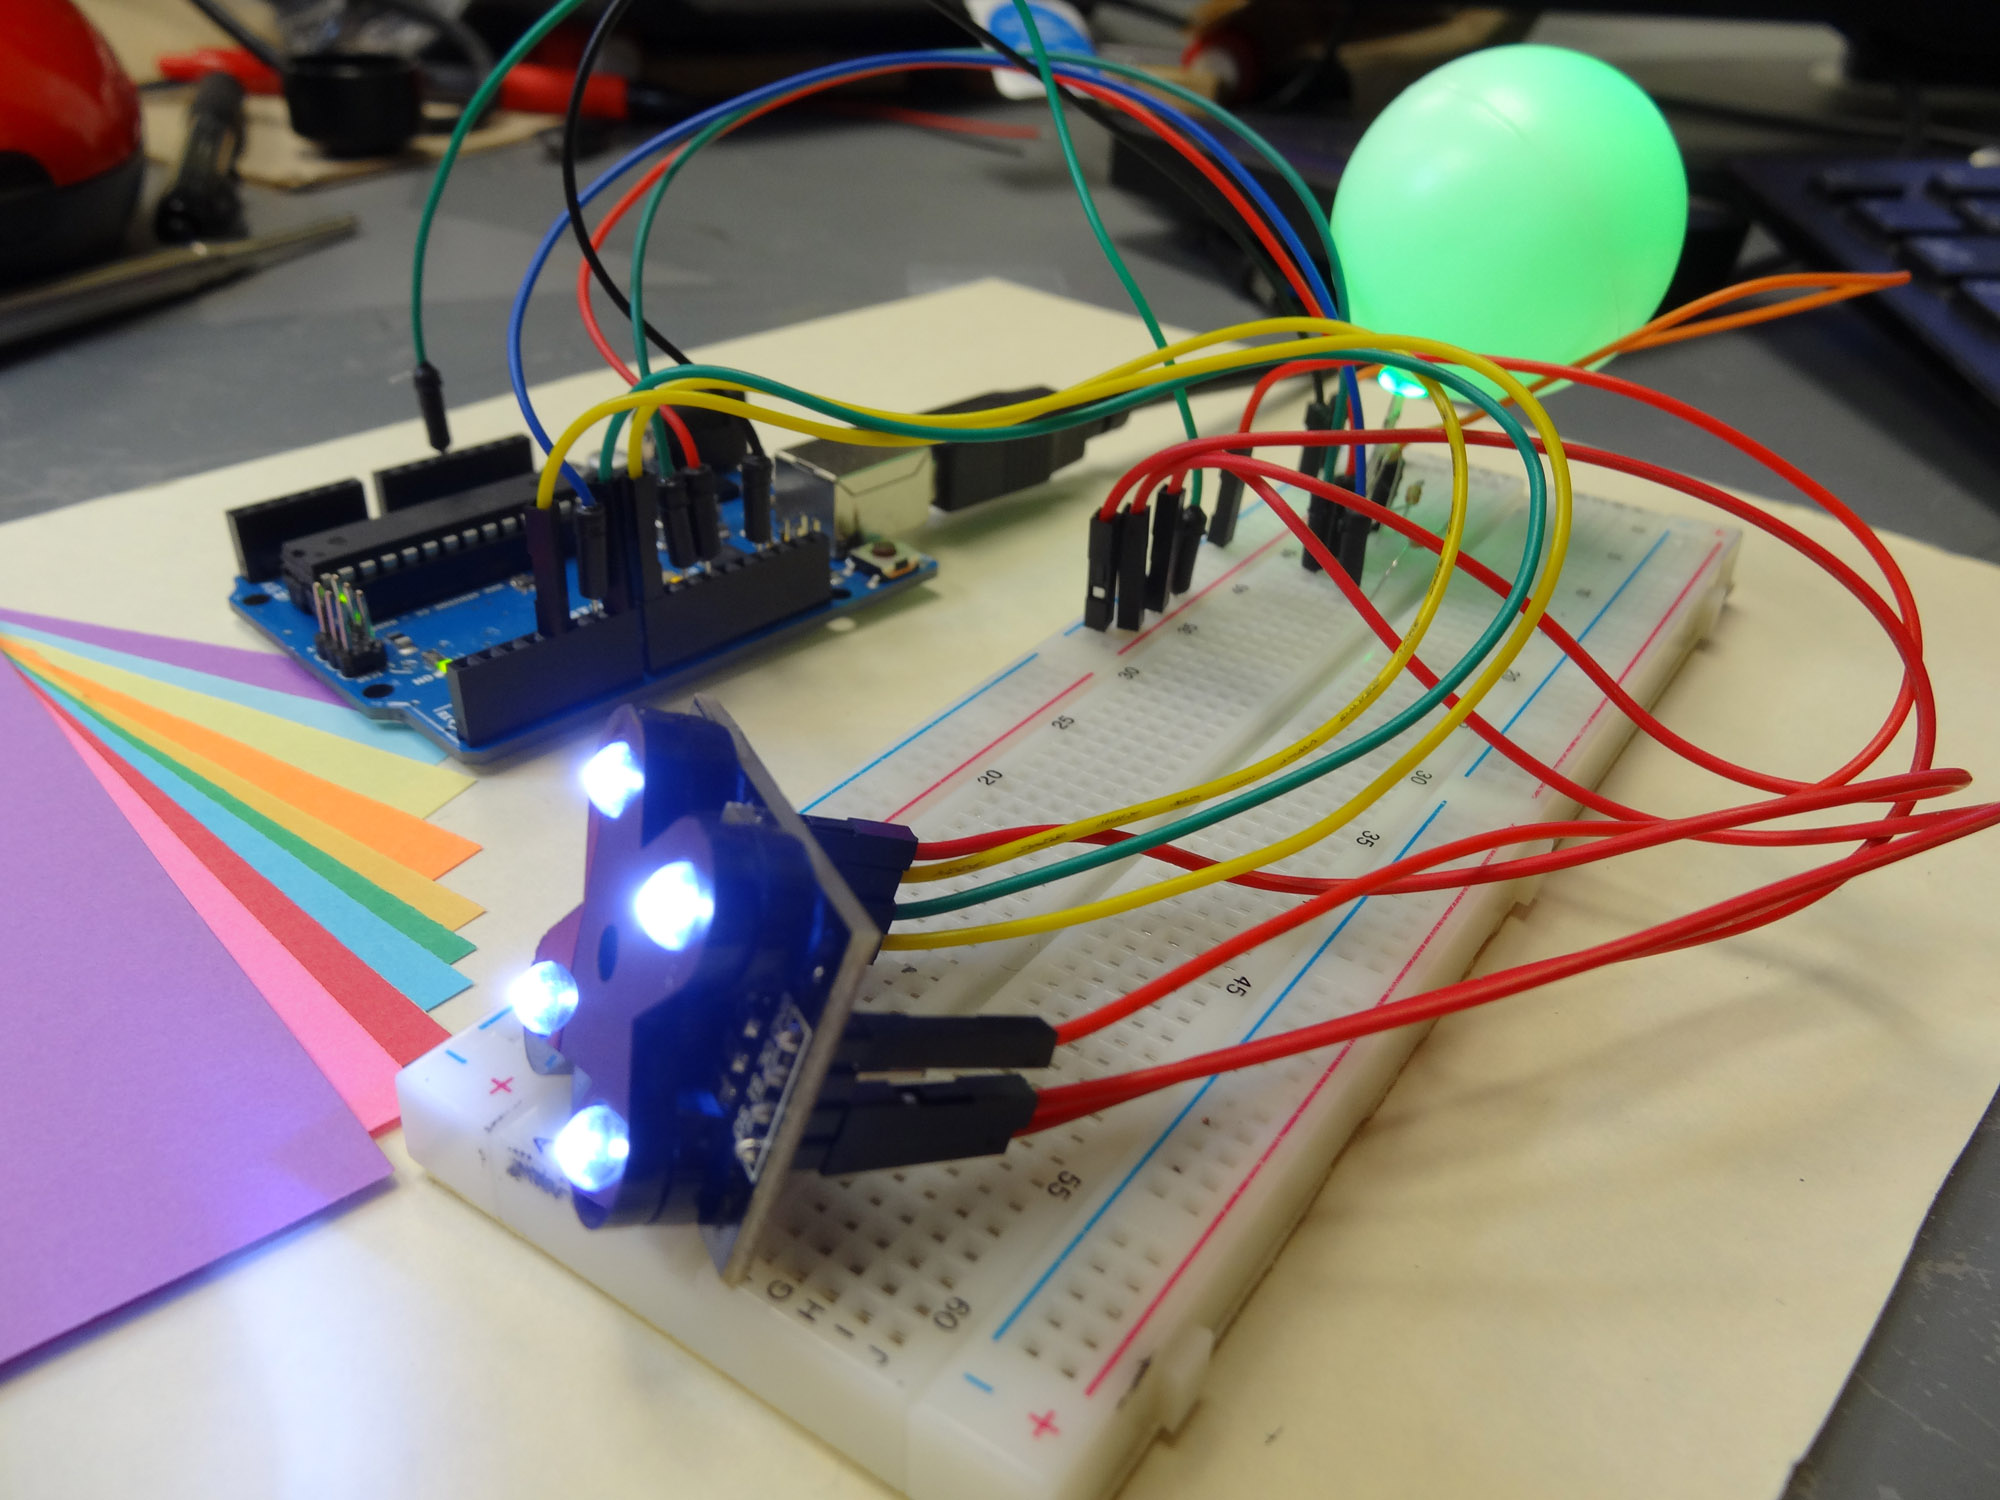
You will need to start with the work in LESSON 4 to get your circuit working, and your arduino programmed up. Once you have done that, you are ready to use Python to program up your virtual world. Remember you will need to have the pyserial and the vPython libraries loaded. We showed how to install the software in Python with Arduino LESSON 2.

In the video we will go through the process step-by-step to create a virtual world. The code we end up with is posted below. You should not copy and paste the code, but just glance at it if you get stuck. In the end, you should develop your own virtual world and just use mine as a guide if you need more help.

 The video explains each line of the code.  Play around and tweak the values and see the effect on your virtual scene. Now your assignment is to take what you have learned here, and continue to expand your virtual world. Add objects to your virtual scene. Perhaps build an object for the breadboard, color sensor and arduino. I will give you several days to do this, and then when I come around for a project grade, I will want to see who has built the most impressive virtual scene. You should go well beyond the simple demonstration I have done here.

Python with Arduino LESSON 4: Expanding your Virtual World

In this lesson we will expand the virtual world we created in Python with Arduino LESSON 3. We will be creating a virtual world that will track a simple scene in the real world. In this project, the virtual world will track both the position and the color of a target in the real world. This lesson requires that you have the Python software and libraries installed, which we explained in LESSON 2.

Arduino Circuit
This is our circuit with the HC-SR04 ultrasonic sensor and the TCS230 Color Sensor

This Lesson will be a bit more involved, and I will take you through it step-by-step. I will need to break things into two parts. In today’s lesson we will cover the Arduino side. We will develop the software that will measure distance and color, and then send those numbers over the serial port. Then in tomorrows lesson, we will develop the Python software to create a really cool virtual graphic to display the data in a virtual world.

For this project you will need the HC-SR04 ultrasonic sensor, the TCS230 Color Sensor, the Arduino Microcontroller, and some male/female jumper wires to connect to the color sensor.

The Ultrasonic Sensor can be attached per the schematic below:

Ultrasonic Sensor Circuit
Simple Circuit for Measuring Distance

Detailed tutorial on using this sensor was described in Arduino LESSON 18, so we will not go through all the details of using the sensor here. Review that lesson if you need more help. Key point here is to connect it as seen in diagram above.

You will also need to connect up the Color Sensor.

Connecting the Color Sensor to the Arduino

Color Sensor Pin
Arduino Pin
S0GND
S15V
S2pin 7
S3pin 8
OUTpin 4
VCC5V
GNDGND

Use of the color sensor was described in detail in Arduino LESSON 15.  You should be able to develop to write the software yourself based on earlier lessons to make measurements from both the Color Sensor, and Ultrasonic Sensor, but if you get stuck, you can glance at my code below. Again, it is important for you to write your own code and not copy and paste mine. Mine is just a reference if you get stuck.

The key point to notice with this code is the print statements, summarized below:

 Notice that we are printing  our color strengths and distance on one line separated by commas. It is important to note the order of the data. When we read this in Python, we will read it in as one line of text, and then we will parse it into its individual values. So, we must make note and remember the order the data is arranged in in this line.

Remember when you have your python program reading this data, you must have your serial monitor closed. For now though, run your program and look at the serial monitor to verify you are getting correct data in the expected format.

In the next Lesson, LESSON 5, we will build the Python program to create a virtual world from this data.

LESSON 1: Using Python With Arduino

Today we are going to start a new series of lessons that will allow you to take your Arduino projects up to the next level. Hopefully you have been through my 20 lessons on using the Arduino. If you are not familiar with the Arduino, you should start with those lessons. If you are familiar with Arduino, you can just right into this series of Lessons.

One of the major limitations of the Arduino IDE is its limited ability to interact with the user.  You can print text to a simple serial monitor text box, or get text input from the user. You can open up a new world of possibilities by using the programming language python to interact with the Arduino. Python combined with Arduino is a powerful combination what will drastically increase the WOW factor of your projects.

The video above will show a cool project that will hopefully motivate you to undertake this series of lessons. Python is a really cool language, and now that you know Arduino, it will be a breeze to learn Python!

LESSON 15: Super Cool Arduino Color Sensor Project

This first video shows just the results of this extremely exciting project!  Watch the first video if you want a quick summary showing the working project.

The second video, below shows an in depth step-by-step tutorial on how to make the project work.

OK, in the first 14 lessons we were laying the ground work for circuits and programming. Now it is time we had a little fun. This project will show you how to do an insanely cool circuit based on what you have learned already. This time we are going to use the RGB LED circuit you worked on in Lesson 13 and Lesson 14,  but this time you will set the color based on the color seen by a color sensor! That is right, we will incorporate a color sensor into the circuit. If the color sensor sees red, the LED will turn red. If it sees blue, the LED will turn blue. Our challenge in this project is to make the sensor match as many colors as well as possible.

Arduino Color Sensor
We will use an arduino color sensor to set the color of the RGB LED

There are a couple of things you will need for this project in addition to the arduino, breadboard, and RGB LED we have been using so far. The good news is the components are very affordable and can be easily ordered from amazon. First up you will need the Virtuobotix Color Sensor which you can order HERE. To connect the color sensor to your arduino you will need some male/female connecting wires, which you can order HERE.  You probably have the rest of the things you need, but I will give a complete list at the end of this lesson.

For the LED side of things you will want to use the same circuit from Lesson 13 and Lesson 14.  As a refresher, here is the schematic;

RGB LED Circuit
Circuit used to control RGB LED from an arduino

Now for this project, instead of getting the desired color from the user via the serial port, we will set the LED color by having it match colored cards we place in front of the sensor. So, we will need to figure out how to operate the sensor. It is really pretty straighforward. First up, we have to hook it to the arduino. That is probably easiest done by following this table, rather than me trying to draw a picture:

Connecting the Color Sensor to the Arduino

Color Sensor Pin
Arduino Pin
S0GND
S15V
S2pin 7
S3pin 8
OUTpin 4
VCC5V
GNDGND

Hopefully that is clear. Remember, you must use the male/female wires described above to connect the Color Sensor to the Arduino. Unfortunately, the sensor is too big to connect to a standard size breadboard. Use the table above to carefully make the connections, but after you are done your circuit should look like this:

Color Sensor
Color Sensor and RGB LED connected to the Arduino

There are lots of wires, so double check your work against the table above.

Now,  this is the way the senor works. It will make three different readings indicating the relative “strength” of the three primary colors  . . . Red, Green and Blue.  Never fear, if you know the strength of the primary colors, you can figure out any color as they will just be different “mixes” of red,  green and blue.

Which color is read depends on the voltages you write to the S2 and S3 pins, according to this table:

S2
S3
Color Read
LOWLOWRed
LOWHIGHBlue
HIGHHIGHGreen

To actually make a measurement, you need to select which color strength you want to read by doing digital writes to pins S2 and S3 according to the pins above. Then you read the color strength on the sensor OUT pin, which we have connected to Arduino pin 4. To make the measurement, you need to make a pulseIn measurement at pin 4 on the arduino. The pulseIn measurement is an arduino command that looks at the pin you specify, and looks for a pulse, and returns to you a number representing the length in microseconds of the pulse seen at the pin specified. For example, lets say we already declared a variable pulseWidth to hold the measured value. The following code would allow us to measure the pulseWidth at the outPin (make sure you have declared both variables, and you should set the pinMode of outPin to be an INPUT,  since you are reading from it;

 This measurement will return a value between 0 an 102,400. Because of this, you need to be sure to declare pulseWidth variable an unsigned int. Normal integers can only hold numbers up to +/- 32,768 an unsigned int allows only positive numbers but allows numbers up to 4,294,967,295. 

The number that is returned which we put in the variable pulseWidth above can be interpreted as such: The lower the number, the stronger the color being read. The larger the number, the weaker the color.

We need to somehow convert this rather odd number into something that means something in the real world. Well, when we write values to an RGB LED we want them to be between 0 and 255.  Also, that is a fairly standard scale to report RGB colors . . . by giving the relative strength of the compoents of R, G, and B on a scale from 0 to 255. First we need to convert 0 to 102,400 to this range.  102,400/400 = 256. Almost exactly what we want! But we need to subtract one. So, we could say that rColorStrength = (pulseWidth/400) – 1. That gets us a number between 0 and 255. Only problem is, remember that in the original pulseWidth, big numbers mean weak colors and small numbers mean strong colors, so we need to fix that. We could fix it by now saying:

rColorStrength = (255 – rColorStrength);

That simply adjusts things so that big numbers now mean strong colors. Also, you can see this example would be for reading red. You would need to repeat by setting S2 and S3 to also create gColorStrenght and bColorStrength for green and blue.

So, with this little bit of math we should have what we need to actually read R, G, and B values that fairly accurately represent the color the sensor is seeing. In the video I go through the code. I am not posting the code on this one because you need to think through it and if you get stuck, the video shows you each step.