In this lesson we will expand the virtual world we created in Python with Arduino LESSON 3. We will be creating a virtual world that will track a simple scene in the real world. In this project, the virtual world will track both the position and the color of a target in the real world. This lesson requires that you have the Python software and libraries installed, which we explained in LESSON 2.

This Lesson will be a bit more involved, and I will take you through it step-by-step. I will need to break things into two parts. In today’s lesson we will cover the Arduino side. We will develop the software that will measure distance and color, and then send those numbers over the serial port. Then in tomorrows lesson, we will develop the Python software to create a really cool virtual graphic to display the data in a virtual world.
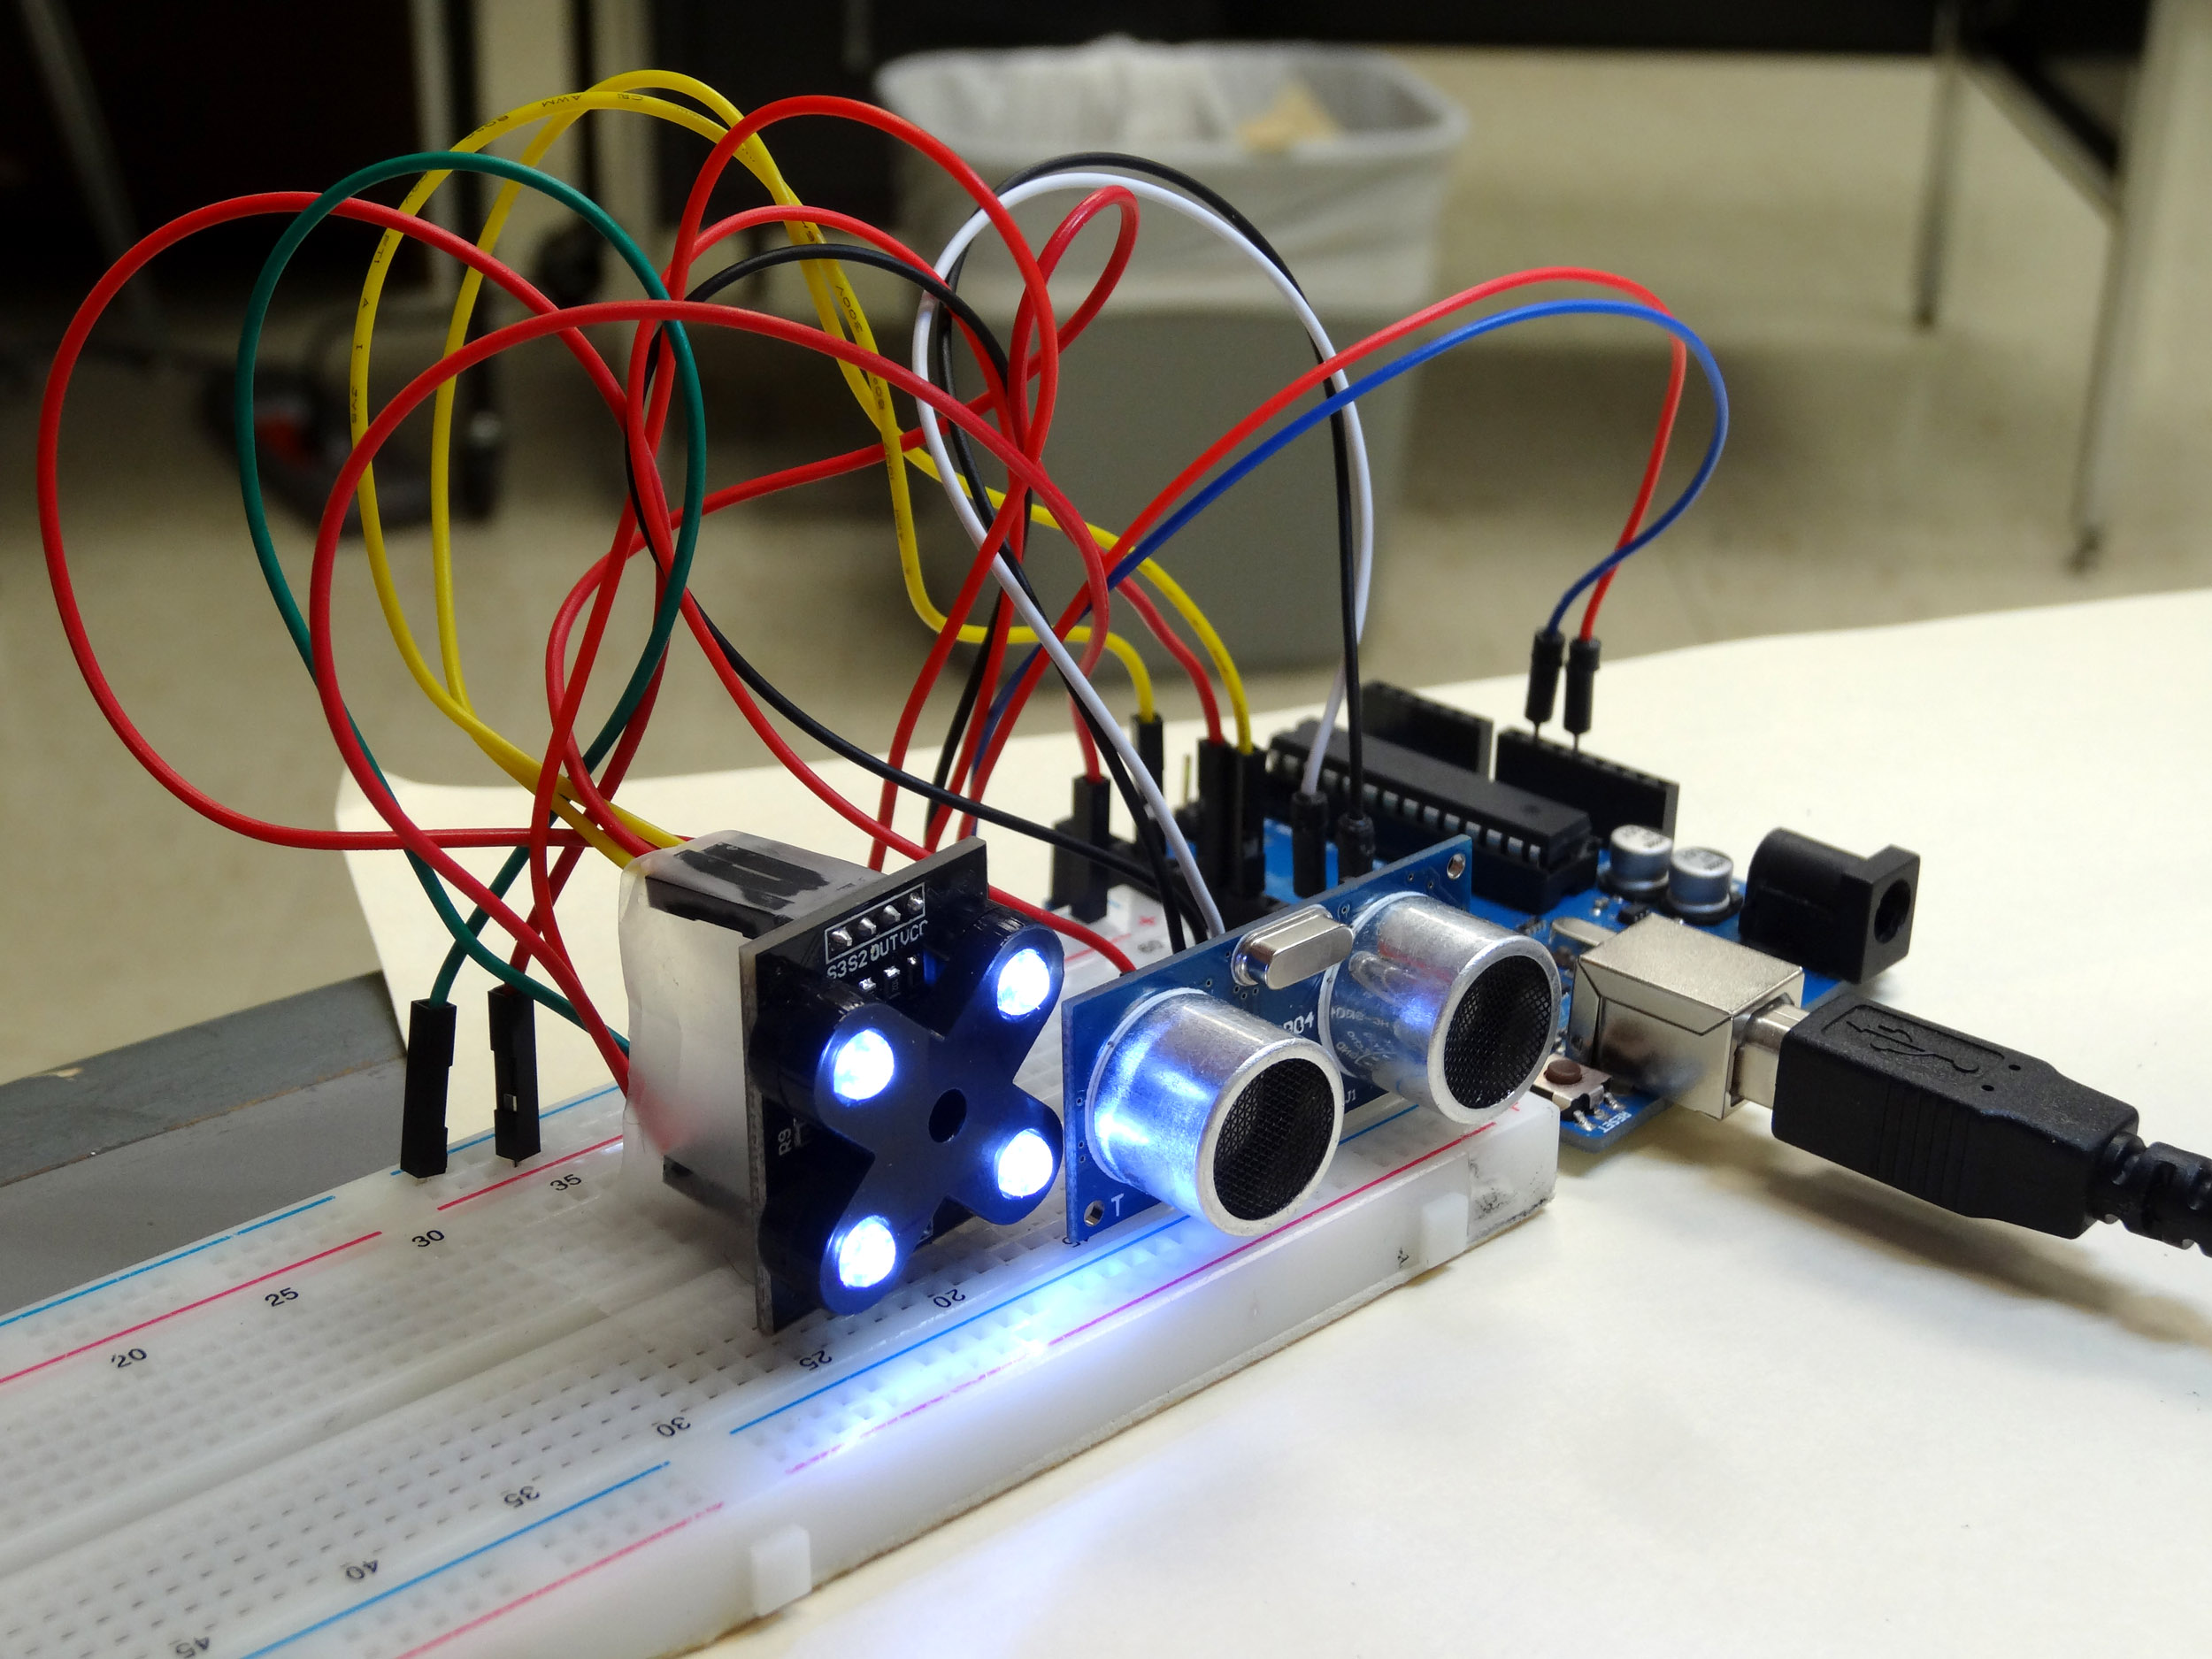
For this project you will need the HC-SR04 ultrasonic sensor, the TCS230 Color Sensor, the Arduino Microcontroller, and some male/female jumper wires to connect to the color sensor.
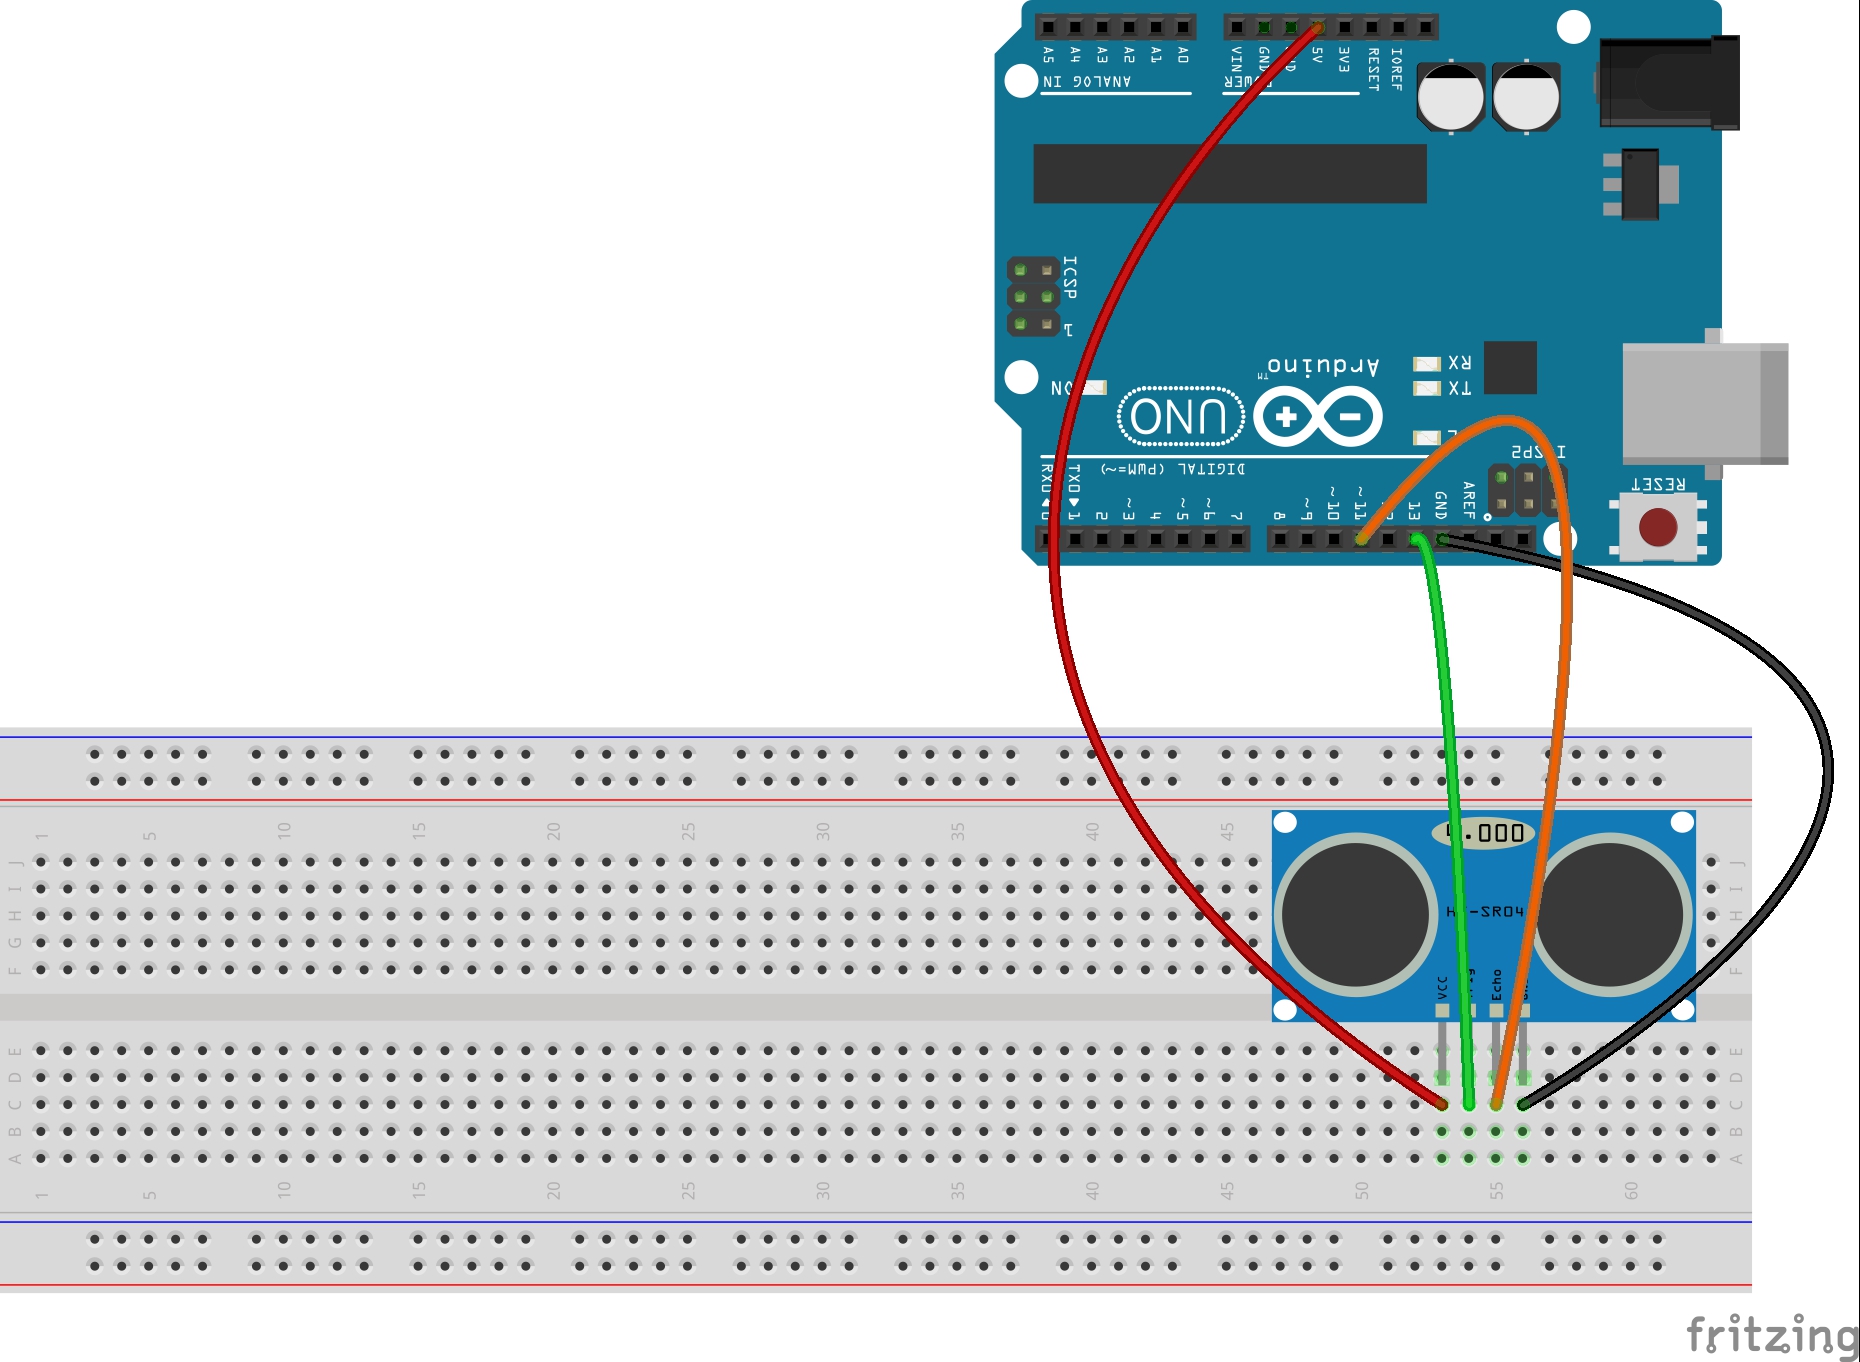
The Ultrasonic Sensor can be attached per the schematic below:

Detailed tutorial on using this sensor was described in Arduino LESSON 18, so we will not go through all the details of using the sensor here. Review that lesson if you need more help. Key point here is to connect it as seen in diagram above.
You will also need to connect up the Color Sensor.
Connecting the Color Sensor to the Arduino | |
Color Sensor Pin | Arduino Pin |
| S0 | GND |
| S1 | 5V |
| S2 | pin 7 |
| S3 | pin 8 |
| OUT | pin 4 |
| VCC | 5V |
| GND | GND |
Use of the color sensor was described in detail in Arduino LESSON 15. You should be able to develop to write the software yourself based on earlier lessons to make measurements from both the Color Sensor, and Ultrasonic Sensor, but if you get stuck, you can glance at my code below. Again, it is important for you to write your own code and not copy and paste mine. Mine is just a reference if you get stuck.
1 2 3 4 5 6 7 8 9 10 11 12 13 14 15 16 17 18 19 20 21 22 23 24 25 26 27 28 29 30 31 32 33 34 35 36 37 38 39 40 41 42 43 44 45 46 47 48 49 50 51 52 53 54 55 56 57 58 59 60 61 62 63 64 65 66 67 68 69 70 71 72 73 74 75 76 77 78 79 80 81 82 83 84 85 86 87 88 89 90 91 92 93 94 95 96 97 98 99 100 101 102 103 104 105 106 107 108 109 110 111 112 113 114 115 116 117 118 119 120 121 122 123 124 125 126 127 128 129 130 131 132 133 134 135 136 137 138 139 140 141 142 143 144 145 146 | int S2= 7; //Color sensore pin S2 to Arduino pin 7 int S3= 8; //Color sensor pin S3 to Arduino pin 8 int outPin = 4; //Color Sensor OUT to Arduino pin 4 int trigPin=13; //Ultrasonic Sensor Trig pin connected to Arduino pin 13 int echoPin=11; //Ultrasonic Sensor Echo pin connected to Arduino pin 11 int rColorStrength; //measured strength of red color int gColorStrength; //measured strength of green color int bColorStrength; //measured strength of blue color unsigned int pulseWidth; //for measuring color strength using pulseIn command float pingTime; //time for ping to travel from sensor to target and return float targetDistance; //Distance to Target in inches float speedOfSound=776.5; //Speed of sound in miles per hour when temp is 77 degrees. void setup() { // put your setup code here, to run once: Serial.begin(115200); //turn on serial port pinMode(S2, OUTPUT); //S2 and S3 are outputs and used to tell pinMode(S3, OUTPUT); //arduino which color to measure pinMode(outPin, INPUT); //This is the pin we read the color from pinMode(trigPin, OUTPUT); //Ultrasonic Trig Pin is an output pinMode(echoPin, INPUT); //Ultradoinic Echo Pin is an input } void loop() { //Lets start by reading Red Component of the Color // S2 and S3 should be set LOW digitalWrite(S2, LOW); digitalWrite(S3, LOW); pulseWidth = pulseIn(outPin, LOW); //Measure raw pulsewidth coming from color sensor outpin rColorStrength = pulseWidth/400. -1; //normalize number to number between 0 and 255 rColorStrength = (255- rColorStrength); //reverse so that large number means strong color //Lets read Green Component of the Color // S2 and S3 should be set HIGH digitalWrite(S2, HIGH); digitalWrite(S3, HIGH); pulseWidth = pulseIn(outPin, LOW); //Measure raw pulsewidth coming from color sensor outpin gColorStrength = pulseWidth/400. -1; //normalize number to number between 0 and 255 gColorStrength = (255- gColorStrength); //reverse so that large number means strong color gColorStrength=gColorStrength + 2; //Lets read Blue Component of the Color // S2 and S3 should be set LOW and HIGH Respectively digitalWrite(S2, LOW); digitalWrite(S3, HIGH); pulseWidth = pulseIn(outPin, LOW); //Measure raw pulsewidth coming from color sensor outpin bColorStrength = pulseWidth/400. -1; //normalize number to number between 0 and 255 bColorStrength = (255- bColorStrength); //reverse so that large number means strong color //Now we need to exagerate the colors because readings from color sensor //are all too close together. Algorithm that appears to work is to //take the strongest color and set to 255, take the weakest color //and set to zero, and then take the middle color and reduce its //value by 2. That is what this next segment of code does. if(rColorStrength>gColorStrength && gColorStrength>bColorStrength) { rColorStrength = 255; gColorStrength = gColorStrength/2; bColorStrength = 0; } if(rColorStrength>bColorStrength && bColorStrength>gColorStrength) { rColorStrength = 255; bColorStrength = bColorStrength/2; gColorStrength = 0; } if(gColorStrength>rColorStrength && rColorStrength>bColorStrength) { gColorStrength = 255; rColorStrength = rColorStrength/2; bColorStrength = 0; } if(gColorStrength>bColorStrength && bColorStrength>rColorStrength) { gColorStrength = 255; bColorStrength = bColorStrength/2; rColorStrength = 0; } if(bColorStrength>rColorStrength && rColorStrength>gColorStrength) { bColorStrength = 255; rColorStrength = rColorStrength/2; gColorStrength = 0; } if(bColorStrength>gColorStrength && gColorStrength>rColorStrength) { bColorStrength = 255; gColorStrength = gColorStrength/2; rColorStrength = 0; } //Now lets measure distance to target from the ultrasonic sensor digitalWrite(trigPin, LOW); //Set trigger pin low delayMicroseconds(2000); //Let signal settle digitalWrite(trigPin, HIGH); //Set trigPin high delayMicroseconds(15); //Delay in high state digitalWrite(trigPin, LOW); //ping has now been sent delayMicroseconds(10); //Delay in low state pingTime = pulseIn(echoPin, HIGH); //pingTime is presented in microceconds pingTime=pingTime/1000000; //convert pingTime to seconds by dividing by 1000000 (microseconds in a second) pingTime=pingTime/3600; //convert pingtime to hours by dividing by 3600 (seconds in an hour) targetDistance= speedOfSound * pingTime; //This will be in miles, since speed of sound was miles per hour targetDistance=targetDistance/2; //Remember ping travels to target and back from target, so you must divide by 2 for actual target distance. targetDistance= targetDistance*63360; //Convert miles to inches by multipling by 63360 (inches per mile) //Now lets print our data to the serial monitor all on one line divided by commas. Serial.print(rColorStrength); Serial.print(" , "); Serial.print(gColorStrength); Serial.print(" , "); Serial.print(bColorStrength); Serial.print(" , "); Serial.println(targetDistance); delay(150); } |
The key point to notice with this code is the print statements, summarized below:
1 2 3 4 5 6 7 | Serial.print(rColorStrength); Serial.print(" , "); Serial.print(gColorStrength); Serial.print(" , "); Serial.print(bColorStrength); Serial.print(" , "); Serial.println(targetDistance); |
Notice that we are printing our color strengths and distance on one line separated by commas. It is important to note the order of the data. When we read this in Python, we will read it in as one line of text, and then we will parse it into its individual values. So, we must make note and remember the order the data is arranged in in this line.
Remember when you have your python program reading this data, you must have your serial monitor closed. For now though, run your program and look at the serial monitor to verify you are getting correct data in the expected format.
In the next Lesson, LESSON 5, we will build the Python program to create a virtual world from this data.
