One of our goals with this series of lessons is to learn how to plot live data in Python. To do that, we need some interesting streaming data from the Arduino. In this lesson we will provide a live stream of temperature and pressure data. We will hook up the circuit, program the arduino, and stream the temperature and pressure data over the serial port. Then in the next lesson, we will read the data stream into Python, and provide a live plot of the incoming data. We will be using the Adafruit BMP180 Pressure Sensor.
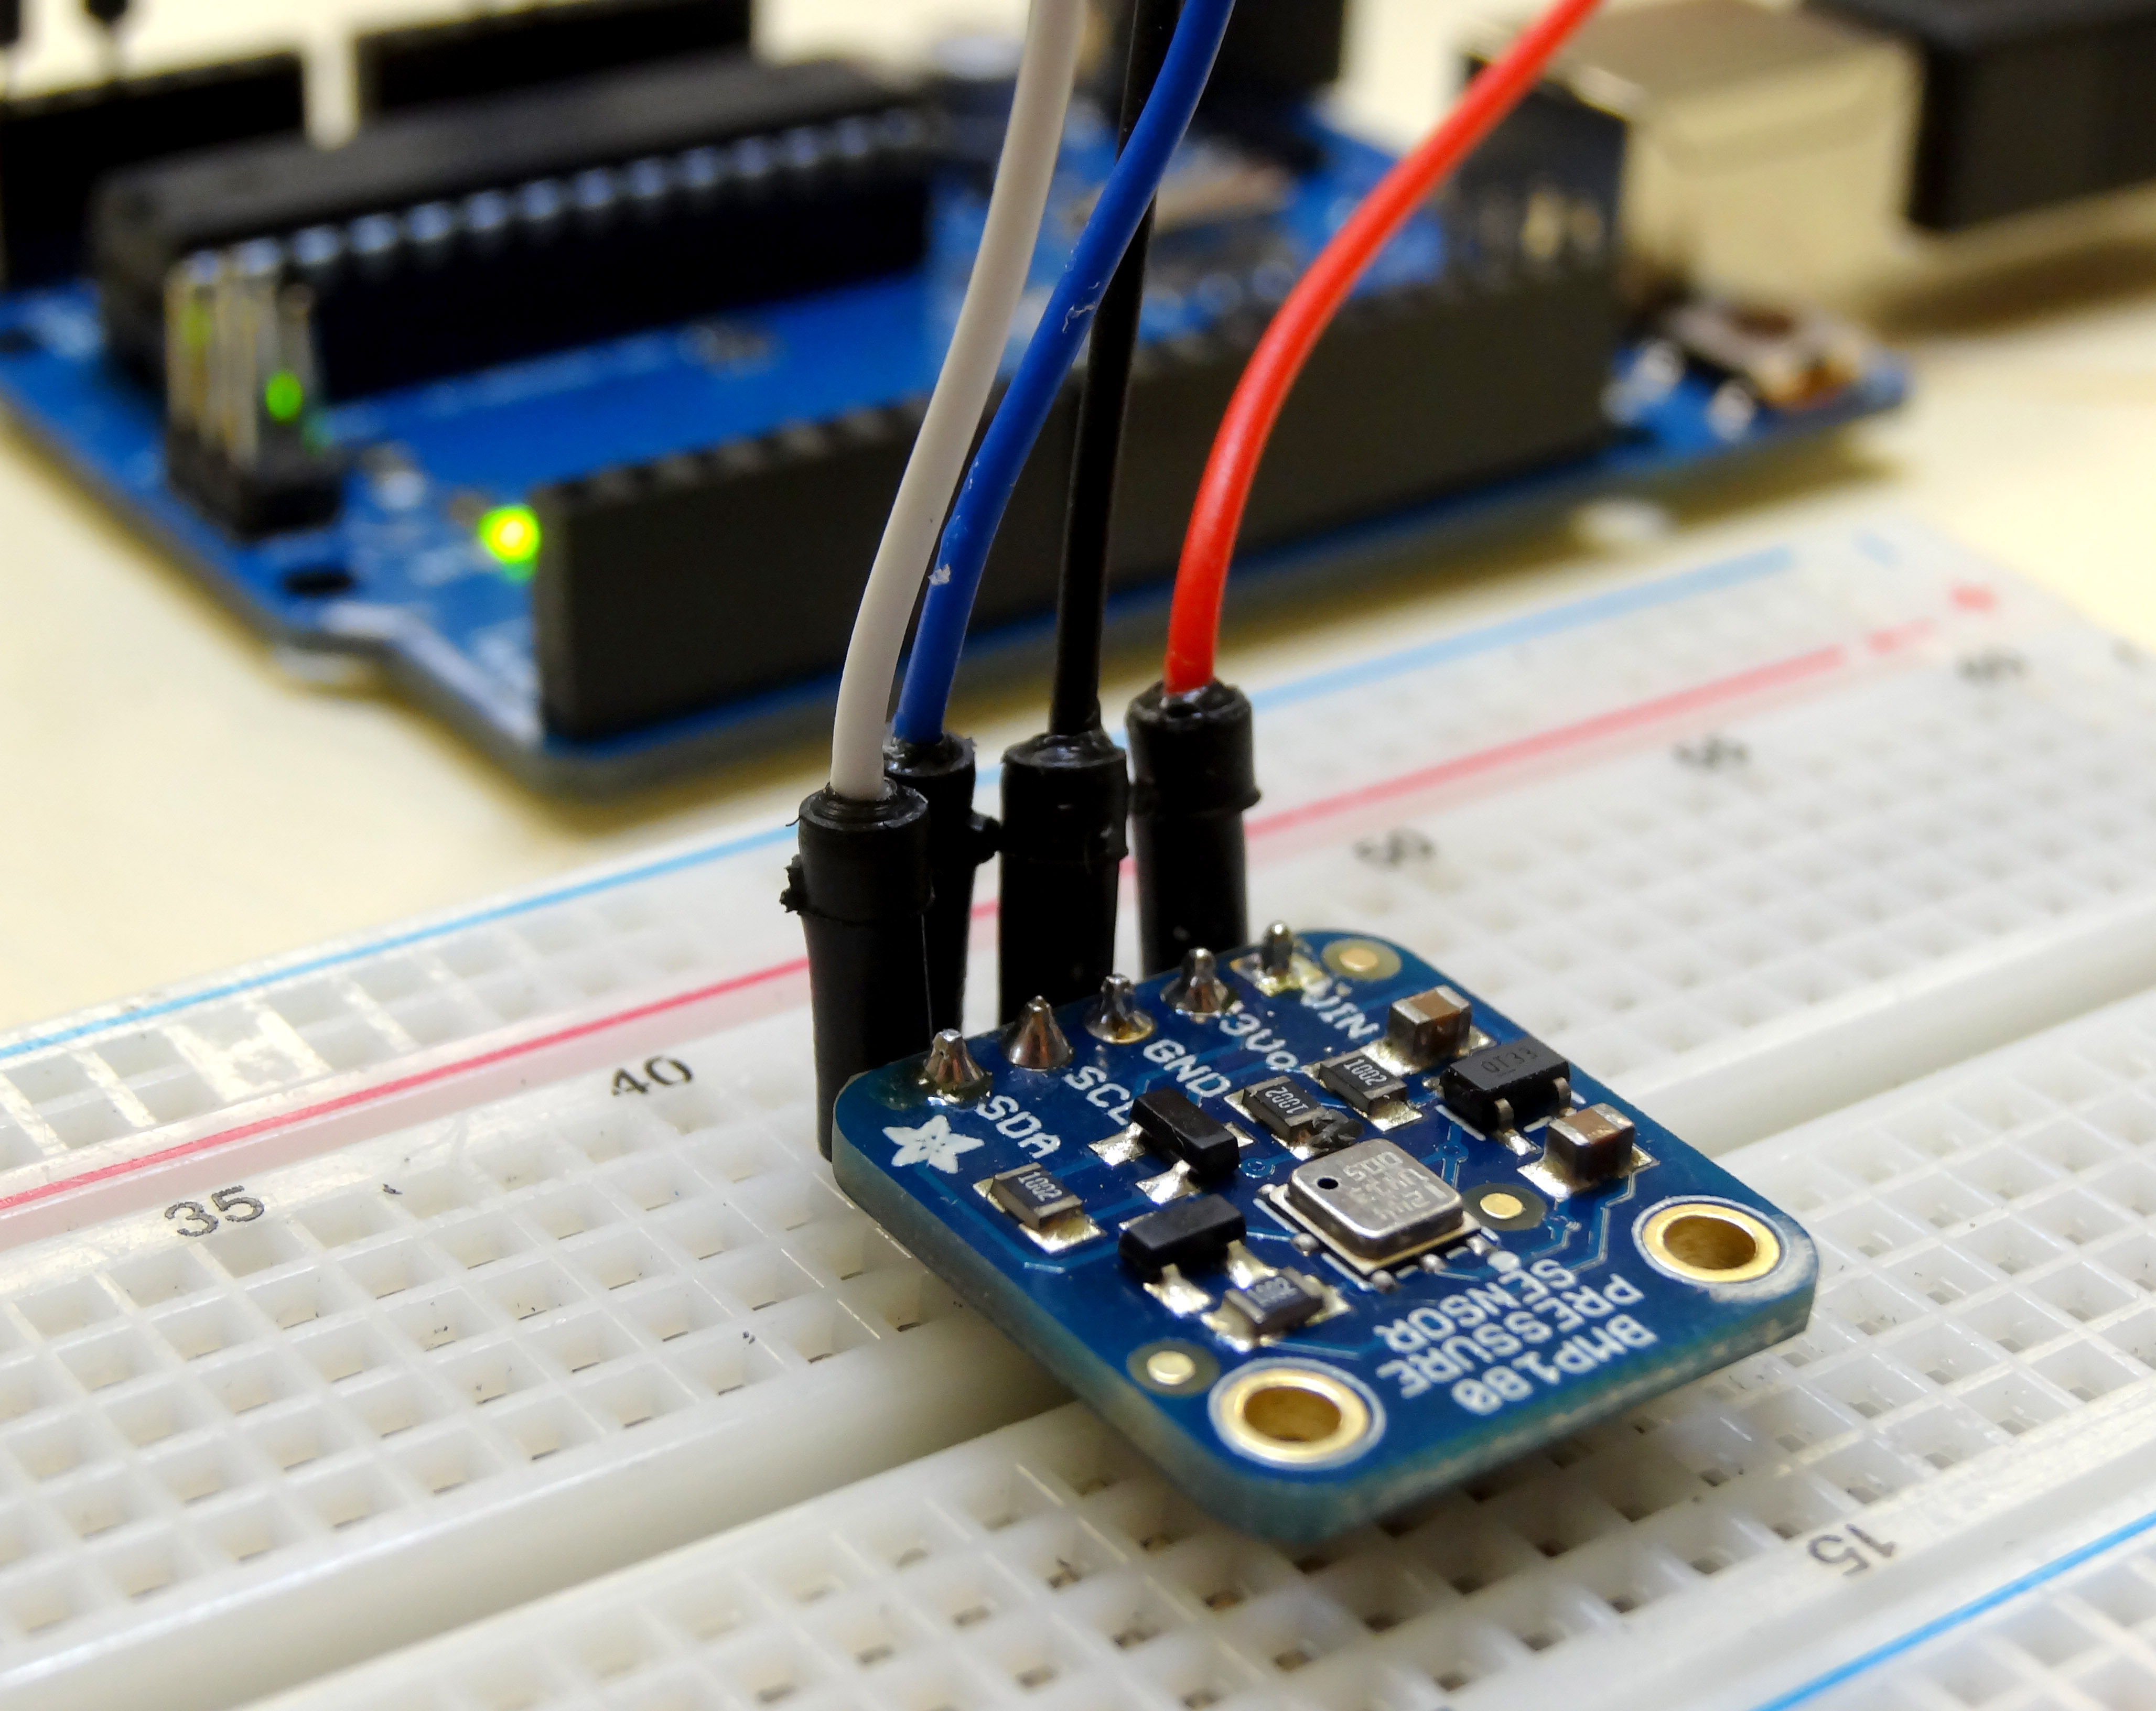
This is the most excellent BMP180 Pressure Sensor from adafruit.
This is a really simple sensor to get set up. To connect it up, use the following connections:
Connecting Up the BMP180 Pressure and Temperature Sensor
BMP180 Pin
Arduino Pin
Vin
5V
GND
GND
SCL
A5
SDA
A4
With the circuit hooked up, you are ready to start coding. The first thing you will need to do is to download and install the adafruit library for this component. I prefer the API V1 version of the library, so we will download that one. Do not worry that the documentation lists a different part number. This is an upgraded version of the sensor, and the documentation still references the old part number. You can download the library for this part here:
Click the “Download the Adafruit_BMP085 Arduino Library” large green box. This will download as a zip folder. Open the zip folder, and then drag and drop the contents on your desktop. You want the contents of the zip folder, not the zip folder itself. Rename the folder you dropped to your desktop “adafruitBMP180”. Now you need to drag and drop this folder into your arduino library folder. To find your arduino library folder, in the arduino IDE window, look in file, preferences. A window should pop open, and it should show you where your arduino sketchbook folder is. Drop your adafruitBMP180 folder into the Library folder of your arduino sketchbook folder. If this is not perfectly clear, watch the video above and you can watch me do it step-by-step. Once your adafruitBMP180 folder is in your arduino library folder, you are ready to start writing your code. You need to kill your arduino IDE window and reopen it for it to find your new library.
Now, to get this sensor to work, you just need a few lines of code. To begin with, you must load the Wire.h library and the Adafruit_BMP085.h library (again, do not worry that the library is named after an earlier model of this sensor). After loading the libraries, you will need to create a sensor object. Then in void setup you will need to start the sensor, and then in void loop begin making measurements. The code below is a nice example of how to do this.
Arduino
1
2
3
4
5
6
7
8
9
10
11
12
13
14
15
16
17
18
19
20
21
22
23
24
25
26
27
#include "Wire.h" // imports the wire library for talking over I2C
#include "Adafruit_BMP085.h" // import the Pressure Sensor Library
Adafruit_BMP085mySensor;// create sensor object called mySensor
floattempC;// Variable for holding temp in C
floattempF;// Variable for holding temp in F
floatpressure;//Variable for holding pressure reading
voidsetup(){
Serial.begin(9600);//turn on serial monitor
mySensor.begin();//initialize mySensor
}
voidloop(){
tempC=mySensor.readTemperature();// Read Temperature
tempF=tempC*1.8+32.;// Convert degrees C to F
pressure=mySensor.readPressure();//Read Pressure
Serial.print("The Temp is: ");//Print Your results
Serial.print(tempF);
Serial.println(" degrees F");
Serial.print("The Pressure is: ");
Serial.print(pressure);
Serial.println(" Pa.");
Serial.println("");
delay(250);//Pause between readings.
}
Now run the program and check your serial monitor and you should see measurements of temperature and pressure. Pressure in Pascals is a big number. To convert Pascals to inches of Mercury, or in Hg, which is what the weather sites usually report, take the Pascal reading, and divide by 3386.389. Then you should be in Inches of Mercury and you can check your reading against a weather report for your area. The numbers should be close.
While it is cool to create 3D visuals using vPython to represent our data coming from arduino, sometimes we want to make more quantitative graphs and charts from the data. To do this, we need to learn how to create graphs in Python. We do this using the library Matplotlib. We learned how to install and download this library in Python with Arduino LESSON 7: If you have not installed the library yet, make sure to go back and do in as shown in LESSON 7.
With the library installed, we are ready to learn Matplotlib. The video takes you through an introductory tutorial with step-by-step instructions. The code below is a sample of how to plot a sin and cos wave. You can watch the video, and then play around with the parameters to become familiar with this library.
Python
1
2
3
4
5
6
7
8
9
10
11
12
13
14
15
importnumpy asnp#import numpy library
importmatplotlib.pyplot asplt#import matplotlib
x=np.linspace(0,2*np.pi,50)#create your x array
y=np.sin(x)#create y array
z=np.cos(x)#create z array
plt.plot(x,y,'b-d',linewidth=2,label='sinx')#plot y
plt.plot(x,z,'r-o',linewidth=2,label='cosx')#plot z
In this series of lessons you have learned to send data from Arduino to Python, and then do some pretty cool things in Python. We have created little virtual worlds, and have done neat dynamic graphics. Unfortunately not all Python libraries are as easy to install as vPython and pySerial. Some are next to impossible to install. The good news is that there is a free program called PIP that will install just about any Python library very easily. We need to pause and install PIP. Many of the future lessons will require you to have PIP installed on your machine. Please follow along with me on the video, which shows you how to install PIP on your windows machine. These links will be useful. You can download pip at this link:
Right mouse click on get-pip.py and download to your desktop. You will then want to run the program in python. We show you how to do this in the video above. Then, you need to edit your system path file by going to the control panel, select system, select advanced settings, and under environmental parameters select the path. Update your path file to show your system where your python folder is and where your python script folder is. If you are unsure of this, watch the video where I show you exactly how to do it. If you are adept with computers, you can just do it from this description. Add the two elements to your path. Adjust the parameters to reflect where your python installation is and where your python script folder is. For me, these are the two things added to my path:
C:\Python27
and
C:\Python27\Scripts
If you do not know exactly what I am saying, then watch the video for more detail.
Once you have these in your system path, you can test your PIP as follows.
Open a CMD box.
Type:
pip install -U pip
This asks pip to update itself. You should see it come up and indicate it is either up to date or is updating. This will tell you that you have the PIP installed correctly.
Your life with Python will now be much easier because your system now knows the path to both your Python program and your PIP installer.
This Lesson finishes the work that was begun in Python with Arduino LESSON 4. In that lesson we built the circuit and programmed the arduino to measure the distance to a target and the color of the target. The program then output that data to the serial port. In today’s lesson we will use python to read that data stream, and use the data to dynamically update a virtual world we create.
You will need to start with the work in LESSON 4 to get your circuit working, and your arduino programmed up. Once you have done that, you are ready to use Python to program up your virtual world. Remember you will need to have the pyserial and the vPython libraries loaded. We showed how to install the software in Python with Arduino LESSON 2.
In the video we will go through the process step-by-step to create a virtual world. The code we end up with is posted below. You should not copy and paste the code, but just glance at it if you get stuck. In the end, you should develop your own virtual world and just use mine as a guide if you need more help.
Python
1
2
3
4
5
6
7
8
9
10
11
12
13
14
15
16
17
18
19
20
21
22
23
24
25
26
27
28
29
30
31
32
33
34
35
36
37
38
39
40
## This program reads data over the serial port
## from that arduino. You have to read an entire line of data
## and then you have to parse it into different number values
## Then those R, G, B numbers are used to make the color of
## a visual object in python change.
importserial#import serial library
fromvisual import*#import vPython library
MyScene=display(title='My Virtual World')#Create your scene and give it a title.
MyScene.width=800#We can set the dimension of your visual box. 800X800 pixels works well on my screen
MyScene.height=800
MyScene.autoscale=False#We want to set the range of the scene manually for better control. Turn autoscale off
MyScene.range=(12,12,12)#Set range of your scene to be 12 inches by 12 inches by 12 inches.
target=box(length=.1,width=10,height=5,pos=(-6,0,0))#Create the object that will represent your target (which is a colored card for our project)
myBoxEnd=box(length=.1,width=10,height=5,pos=(-8.5,0,0))#This object is the little square that is the back of the ultrasonic sensor
myTube2=cylinder(color=color.blue,pos=(-8.5,0,-2.5),radius=1.5,length=2.5)#One of the 'tubes' in the front of the ultrasonic sensor
sensorData=serial.Serial('com11',115200)# Create senorData object to read serial port data coming from arduino
whileTrue:#This is a while loop that will loop forever, since True is always True.
rate(25)#We need to tell Vpython how fast to go through the loop. 25 times a second works pretty well
while(sensorData.inWaiting()==0):# Wait here untill there is data on the Serial Port
pass# Do nothing, just loop until data arrives
textline=sensorData.readline()# read the entire line of text
dataNums=textline.split(',')#Remember to split the line of text into an array at the commas
red=float(dataNums[0])# Make variables for Red, Blue, Green. Remember
green=float(dataNums[1])# the array was read as text, so must be converted
blue=float(dataNums[2])# to numbers with float command
dist=float(dataNums[3])# last number in the list is the distance
blue=blue*.7#On my sensor, blue is always a little too strong, so I tone it down a little
if(dist>=1.5anddist<=2.25):#only change color or target if target is between 1.5 and 2.25 inches from sensor
target.color=(red/255.,green/255.,blue/255.)#This keeps color from flickering.
target.pos=vector(-6+dist,0,0)#Adjust the position of the target object to match the distance of the real target from the real sensor
The video explains each line of the code. Play around and tweak the values and see the effect on your virtual scene. Now your assignment is to take what you have learned here, and continue to expand your virtual world. Add objects to your virtual scene. Perhaps build an object for the breadboard, color sensor and arduino. I will give you several days to do this, and then when I come around for a project grade, I will want to see who has built the most impressive virtual scene. You should go well beyond the simple demonstration I have done here.
In this tutorial we will show how you can use Python with the Vpython library to begin to create some pretty cool graphics for presenting sensor data from the Arduino. For this tutorial, we will be using the HC-SR04 ultrasonic sensor, which you learned about in Arduino LESSON 17,Arduino LESSON 18, and Arduino LESSON 20. Please review those lessons if you are not familiar with the HC-SR04.
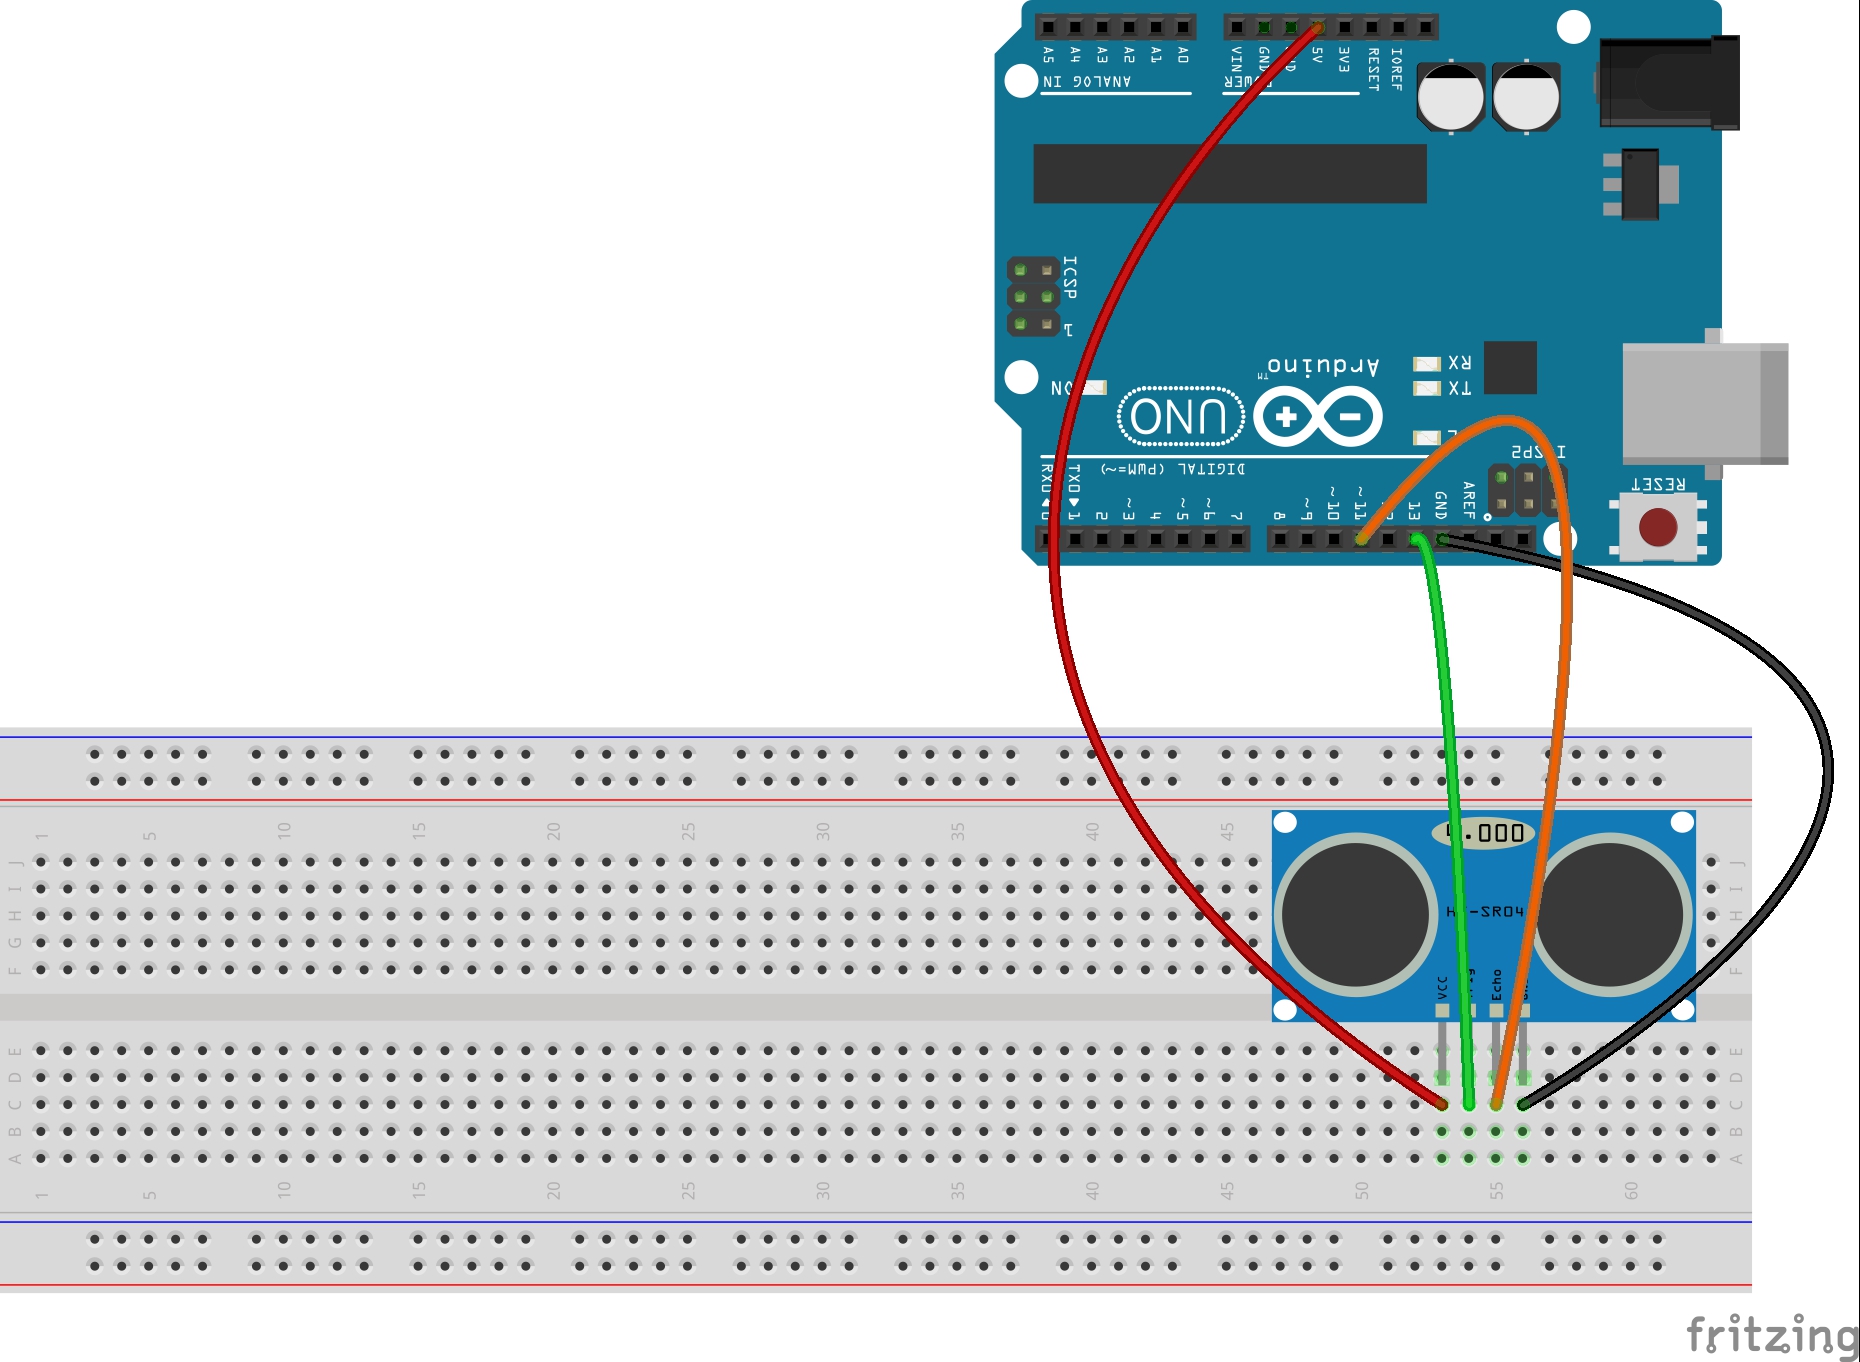
The circuit is very simple and can be connected from this schematic:
Simple Circuit for Operating the HC-SR04 Ultrasonic Sensor.
Since the object of this lesson is to show what you can do using Python and Vpython, I will not go through the arduino code step-by-step. You can go back to the earlier lessons for more info on the HC-SR04 sensor. The code that will allow the sensor to make distance measurements is presented again here. The one thing to note is that since we are going to be using Python to graphically present the data coming from the sensor, we want to simply send the distance measurement over the serial port, and no words or anything else, just the raw distance measurement. This will simplify things on the Python side. Remember that when we do a Serial.println() command in arduino, we can read whatever is printed into Python, as we learned in Arduino and Python LESSON 2. The code below is what you need on the Arduino side.
Arduino
1
2
3
4
5
6
7
8
9
10
11
12
13
14
15
16
17
18
19
20
21
22
23
24
25
26
27
28
29
30
31
32
33
34
inttrigPin=13;//Sensor Trig pin connected to Arduino pin 13
intechoPin=11;//Sensor Echo pin connected to Arduino pin 11
floatpingTime;//time for ping to travel from sensor to target and return
floattargetDistance;//Distance to Target in inches
floatspeedOfSound=776.5;//Speed of sound in miles per hour when temp is 77 degrees.
voidsetup(){
// put your setup code here, to run once:
Serial.begin(9600);
pinMode(trigPin,OUTPUT);
pinMode(echoPin,INPUT);
}
voidloop(){
// put your main code here, to run repeatedly:
digitalWrite(trigPin,LOW);//Set trigger pin low
delayMicroseconds(2000);//Let signal settle
digitalWrite(trigPin,HIGH);//Set trigPin high
delayMicroseconds(15);//Delay in high state
digitalWrite(trigPin,LOW);//ping has now been sent
delayMicroseconds(10);//Delay in low state
pingTime=pulseIn(echoPin,HIGH);//pingTime is presented in microceconds
pingTime=pingTime/1000000;//convert pingTime to seconds by dividing by 1000000 (microseconds in a second)
pingTime=pingTime/3600;//convert pingtime to hourse by dividing by 3600 (seconds in an hour)
targetDistance=speedOfSound*pingTime;//This will be in miles, since speed of sound was miles per hour
targetDistance=targetDistance/2;//Remember ping travels to target and back from target, so you must divide by 2 for actual target distance.
targetDistance=targetDistance*63360;//Convert miles to inches by multipling by 63360 (inches per mile)
Serial.println(targetDistance);
delay(100);//delay tenth of a second to slow things down a little.
}
This code will be constantly sending the distance to the target out over the Serial port. On the Python side, our first task is to read that data in over the serial port. To do this, you must import the serial library. (Instructions on installing Pyserial are in Arduino with Python LESSON2.) You then create a serial object which will be used to read the data. In the sample below, we call the object ‘arduinoSerialData’. We then create a While loop that loops continuously. Inside that loop we check to see if there is any data available on the serial port, and if there is, we read it into the variable myData, and print it.
Python
1
2
3
4
5
6
7
8
9
importserial#Import Serial Library
arduinoSerialData=serial.Serial('com11',9600)#Create Serial port object called arduinoSerialData
while(1==1):
if(arduinoSerialData.inWaiting()>0):
myData=arduinoSerialData.readline()
printmyData
Remember than in the line that creates the adruinoSerialData object, you need to change the com port to whatever com port your arduino is sending on. You can see this by looking under tools- port in your arduino IDE window. Also, this format is for windows machines. You would have to adjust for apple computers.
It is important to remember that the command .readline() in Python will read a string, so we need to remember that myData is a string, and if we want to use it as a number we will need to convert it to a float, with something like distance = float (myData). Then distance will be a normal number, not a string.
As a first demonstration lets create an object using the vPython library that is a cylinder. We will need to import the vPython library, and we will create the object before the while loop, and then inside the while loop, we will adjust the length parameter of the cylinder. We will make the cylinder with a length of six inches, we will make it yellow in color, and with a radius of 1/2 inch. Also, when we are using Vpython and dynamically updating a graphic object, inside the loop that is adjusting the graphic, we have to issue a rate() command. The rate command tells vPython how many times a second you want to go through the loop. You need to play with this command, so that it gives smooth graphics for the rate at which the Arduino is sending data. rate(20) is sometimes a good starting point. So, our code now looks like this:
Python
1
2
3
4
5
6
7
8
9
10
11
12
importserial#Import Serial Library
fromvisual import*#Import all the vPython library
arduinoSerialData=serial.Serial('com11',9600)#Create an object for the Serial port. Adjust 'com11' to whatever port your arduino is sending to.
while(1==1):#Create a loop that continues to read and display the data
rate(20)#Tell vpython to run this loop 20 times a second
if(arduinoSerialData.inWaiting()>0):#Check to see if a data point is available on the serial port
myData=arduinoSerialData.readline()#Read the distance measure as a string
printmyData#Print the measurement to confirm things are working
distance=float(myData)#convert reading to a floating point number
measuringRod.length=distance#Change the length of your measuring rod to your last measurement
So, this is pretty cool! It creates a little rod, and the length of the little rod dynamically changes in response to how far your target is from your sensor. This gives a very nice qualitative visual to what is happening in the real world with your sensor. Often times you also want quantitative indication of the data. We can do that by adding a label. Before the while loop, we will create a label object called lengthLabel. We will position it up just a little bit, so it is not on top of the measuringRod. We will set the label initially to ‘Target Distance is: ‘. We will also want to set box=false, since we do not want a box around our text. Then, a good height for the label is about 30 pixels. You can play around with all these settings. We create the lengthLabel before the while loop, but then inside the while loop we dynamically update the lengthLabel.text parameter. We set it to our myLabel string, which is dynamically being updated to be the concatination of the string ‘Target Distance is: ‘ and the string myData. Remember, myData is read as a string, and so we use that variable, and not distance, which is a number, not a string. Pulling this together leads to this code:
Arduino
1
2
3
4
5
6
7
8
9
10
11
12
13
14
15
importserial#Import Serial Library
fromvisualimport*#Import all the vPython library
arduinoSerialData=serial.Serial('com11',9600)#Create an object for the Serial port. Adjust 'com11' to whatever port your arduino is sending to.
lengthLabel=label(pos=(0,1,0),text='Target Distance is: ',box=false,height=30)
while(1==1):#Create a loop that continues to read and display the data
rate(20)#Tell vpython to run this loop 20 times a second
if(arduinoSerialData.inWaiting()>0):#Check to see if a data point is available on the serial port
myData=arduinoSerialData.readline()#Read the distance measure as a string
printmyData#Print the measurement to confirm things are working
distance=float(myData)#convert reading to a floating point number
measuringRod.length=distance#Change the length of your measuring rod to your last measurement
myLabel='Target Distance is: '+myData#Create label by appending string myData to string
lengthLabel.text=myLabel#display updated myLabel on your graphic
Lets keep playing around with this. The graphic will begin to look more like a’Virtual World’ if we create a box to represent the target we are using in the real world. I will make the box the dimensions of the real target, which is .2 X 3 X 3. Also, I will make it green, just like the target in the real world. In order to better fill our viewing window, I will move the cylinder down by about 2 inches, so its new position will be (-3,-2,0). For box type objects position is measured from the center, so I will need to also move the target box down by about .5, so it will coincide with the measuring rod. this is because 1/2 the target would be 1.5, and moving down by an additional .5 will make it coincide with the measuringRod.
Finally, I need to dynamically update the position of the target box in the while loop. I will need it to be placed at target.pos=(-3+distance,-.5,0). Along the x-axis this will put it right at the end of the rod, and will keep it properly positioned in y, as before. Bringing all this code together we get:
Arduino
1
2
3
4
5
6
7
8
9
10
11
12
13
14
15
16
17
importserial#Import Serial Library
fromvisualimport*#Import all the vPython library
arduinoSerialData=serial.Serial('com11',9600)#Create an object for the Serial port. Adjust 'com11' to whatever port your arduino is sending to.
while(1==1):#Create a loop that continues to read and display the data
rate(20)#Tell vpython to run this loop 20 times a second
if(arduinoSerialData.inWaiting()>0):#Check to see if a data point is available on the serial port
myData=arduinoSerialData.readline()#Read the distance measure as a string
printmyData#Print the measurement to confirm things are working
distance=float(myData)#convert reading to a floating point number
measuringRod.length=distance#Change the length of your measuring rod to your last measurement
target.pos=(-3+distance,-.5,0)
myLabel='Target Distance is: '+myData#Create label by appending string myData to string
lengthLabel.text=myLabel#display updated myLabel on your graphic
Play around with the parameters until you get something you are happy with. Also, you can change your view of the visual once the program is running. Right mouse click and you can change your positional view of the virtual world you have created. Press and scroll the mouse wheel to change the zoom.
OK, you need to start exploring and creating your own virtual world. Go ahead and see if you can create additional objects to make your virtual world more realistic. Try creating a graphic for the sensor itself, and maybe even your PC board and arduino! You can refer to the Vpython site for more details on the 3D objects you can create, and their parameters at:
http://vpython.org/contents/docs/cylinder.html
Also, if the discription in this lesson is confusing at all please just watch the video, and I will take you through things one step at a time.
Making The World a Better Place One High Tech Project at a Time. Enjoy!