Tag Archives: Temperature

Arduino Tutorial 51: DHT11 Temperature and Humidity Sensor with LCD Display

This shows our completed build with an Arduino Nano, LCD and DHT11 Sensor

In this lesson we work towards a stand alone Temperature and Humidity project using the DHT11 sensor.

This video will take you through the build and coding step-by-step, and the schematics below will help you follow along at home.

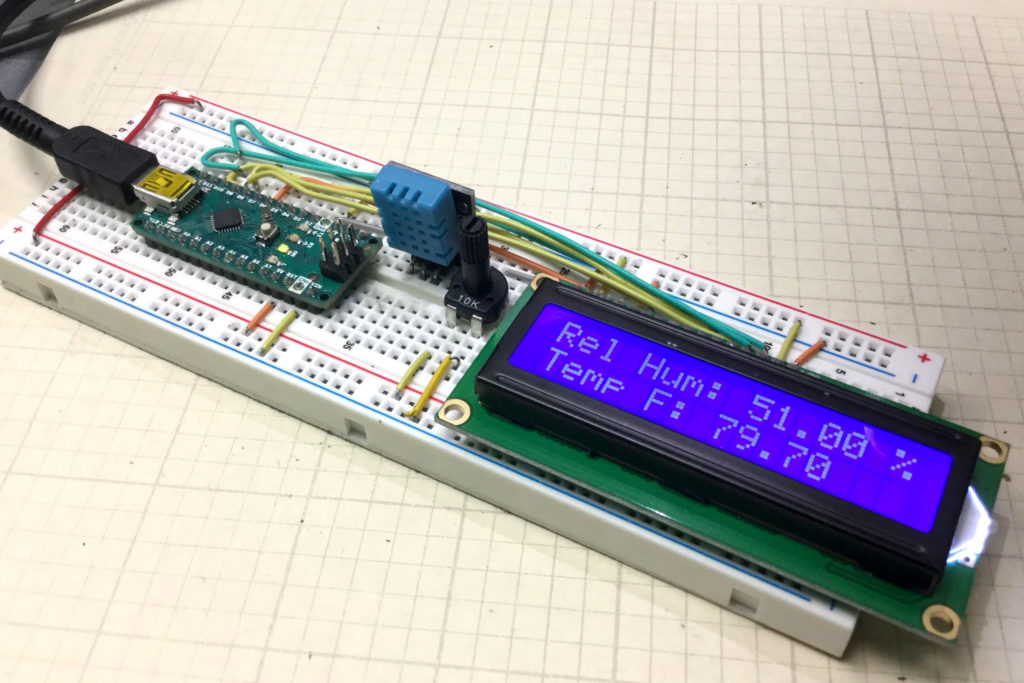
Our goal in this lesson is to add an LCD to the project. In lesson 50, we got the sensor working, and here we want to get the LCD connected. We are working with components from the Elegoo kit, which you can get HERE. In addition, your build can be much neater, cleaner and more stable is you use an arduino nano, instead of the standard arduino uno. The nano is small, and has male pins that allow it to be plugged directly into the breadboard, as seen above. I strongly suggest picking up an Arduino Nano, which you can get HERE. This lesson follows on to the work done in lesson 50. To recap, the DHT11 is connected as follows:

Connection schematic for the DHT11 Temperature Sensor.

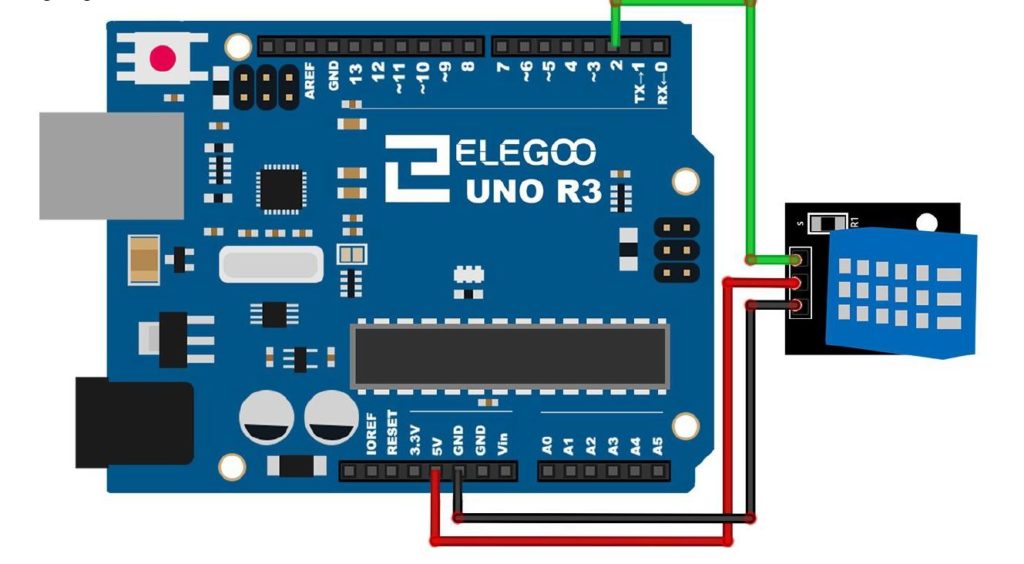
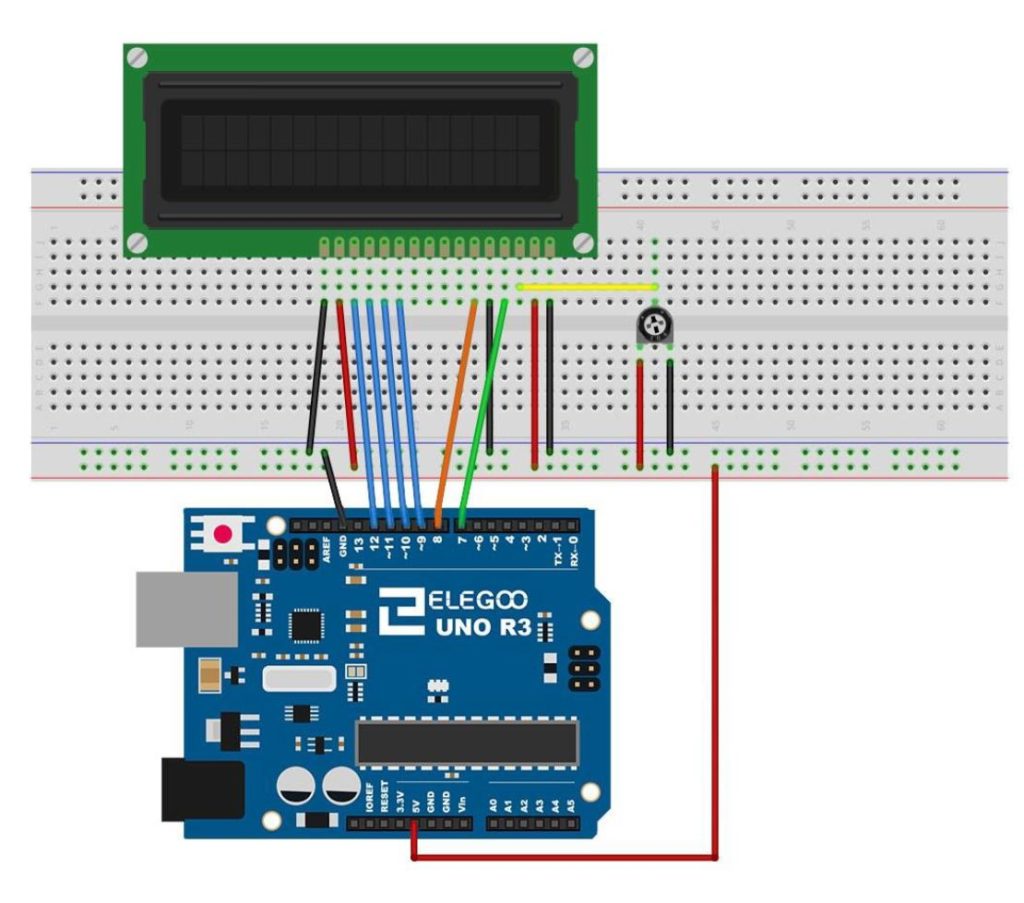
You will also need to add the LCD, using the following schematic:

This schematic will allow you to connect the LCD to the

In my photograph at the top of the post, you can see it is important to keep the build neat, as there are lots of connections which must be made. Neat work is facilitated is you use short jumper wires, instead of the big male to male wires. You can get a jumper wire set that will keep your work neat HERE.  I am not trying to sell you a bunch of junk, but as projects get more complicated, you really need to use the short straight wires, or your build will become a rat’s nest.

We develop the code in the video in detail, but you can get the finished code down below.


Arduino Tutorial 50: How to Connect and Use the DHT11 Temperature and Humidity Sensor

In this lesson we show how to measure Temperature and Humidityusing the DHT11 sensor. This is a relatively simple sensor to use, but you will have to download and install a library. In our earlier lessons, we have used libraries before, but this is the first time you will have to download a library. The library I used was downloaded from HERE. The video explains in detail how to install the library, but in a nutshell you download the library from clicking the link on that page. Then you need to open the downloaded zip file, and then drag and drop the contents of the zip file to your desktop. Next you must determine where your arduino library folder is. You can do that by going to the arduino IDE, and under “file” select preferences. This will show you your “Sketchbook Location”, and that folder will contain your libraries folder. The folder you dragged and dropped onto your desktop should be dragged and dropped now into this library folder. The video shows you how to do this if this description is not clear. Now you will need to connect the sensor, according to this schematic:

Connection schematic for the DHT11 Temperature Sensor.

The video develops the code to use this sensor step-by-step, but the code is included below for your convenience.


Python with Arduino LESSON 9: Measuring Pressure and Temperature with the BMP180 Sensor

One of our goals with this series of lessons is to learn how to plot live data in Python. To do that, we need some interesting streaming data from the Arduino. In this lesson we will provide a live stream of temperature and pressure data. We will hook up the circuit, program the arduino, and stream the temperature and pressure data over the serial port. Then in the next lesson, we will read the data stream into Python, and provide a live plot of the incoming data. We will be using the Adafruit BMP180 Pressure Sensor.

This is the most excellent BMP180 Pressure Sensor from adafruit.

This is a really simple sensor to get set up. To connect it up, use the following connections:

Connecting Up the BMP180 Pressure and Temperature Sensor
BMP180 Pin Arduino Pin
Vin 5V
GND GND
SCL A5
SDA A4


With the circuit hooked up, you are ready to start coding. The first thing you will need to do is to download and install the adafruit library for this component. I prefer the API V1 version of the library, so we will download that one. Do not worry that the documentation lists a different part number. This is an upgraded version of the sensor, and the documentation still references the old part number. You can download the library for this part here:

https://learn.adafruit.com/bmp085/using-the-bmp085

Click the “Download the Adafruit_BMP085 Arduino Library” large green box. This will download as a zip folder. Open the zip folder, and then drag and drop the contents on your desktop.  You want the contents of the zip folder, not the zip folder itself. Rename the folder you dropped to your desktop “adafruitBMP180”. Now you need to drag and drop this folder into your arduino library folder. To find your arduino library folder, in the arduino IDE window, look in file, preferences. A window should pop open, and it should show you where your arduino sketchbook folder is.  Drop your adafruitBMP180 folder into the Library folder of your arduino sketchbook folder. If this is not perfectly clear, watch the video above and you can watch me do it step-by-step. Once your adafruitBMP180 folder is in your arduino library folder, you are ready to start writing your code. You need to kill your arduino IDE window and reopen it for it to find your new library.

Now, to get this sensor to work, you just need a few lines of code. To begin with, you must load the Wire.h library and the Adafruit_BMP085.h library (again, do not worry that the library is named after an earlier model of this sensor).  After loading the libraries, you will need to create a sensor object. Then in void setup you will need to start the sensor, and then in void loop begin making measurements. The code below is a nice example of how to do this.

Now run the program and check your serial monitor and you should see measurements of temperature and pressure. Pressure in Pascals is a big number. To convert Pascals to inches of Mercury, or in Hg, which is what the weather sites usually report, take the Pascal reading, and divide by 3386.389. Then you should be in Inches of Mercury and you can check your reading against a weather report for your area. The numbers should be close.