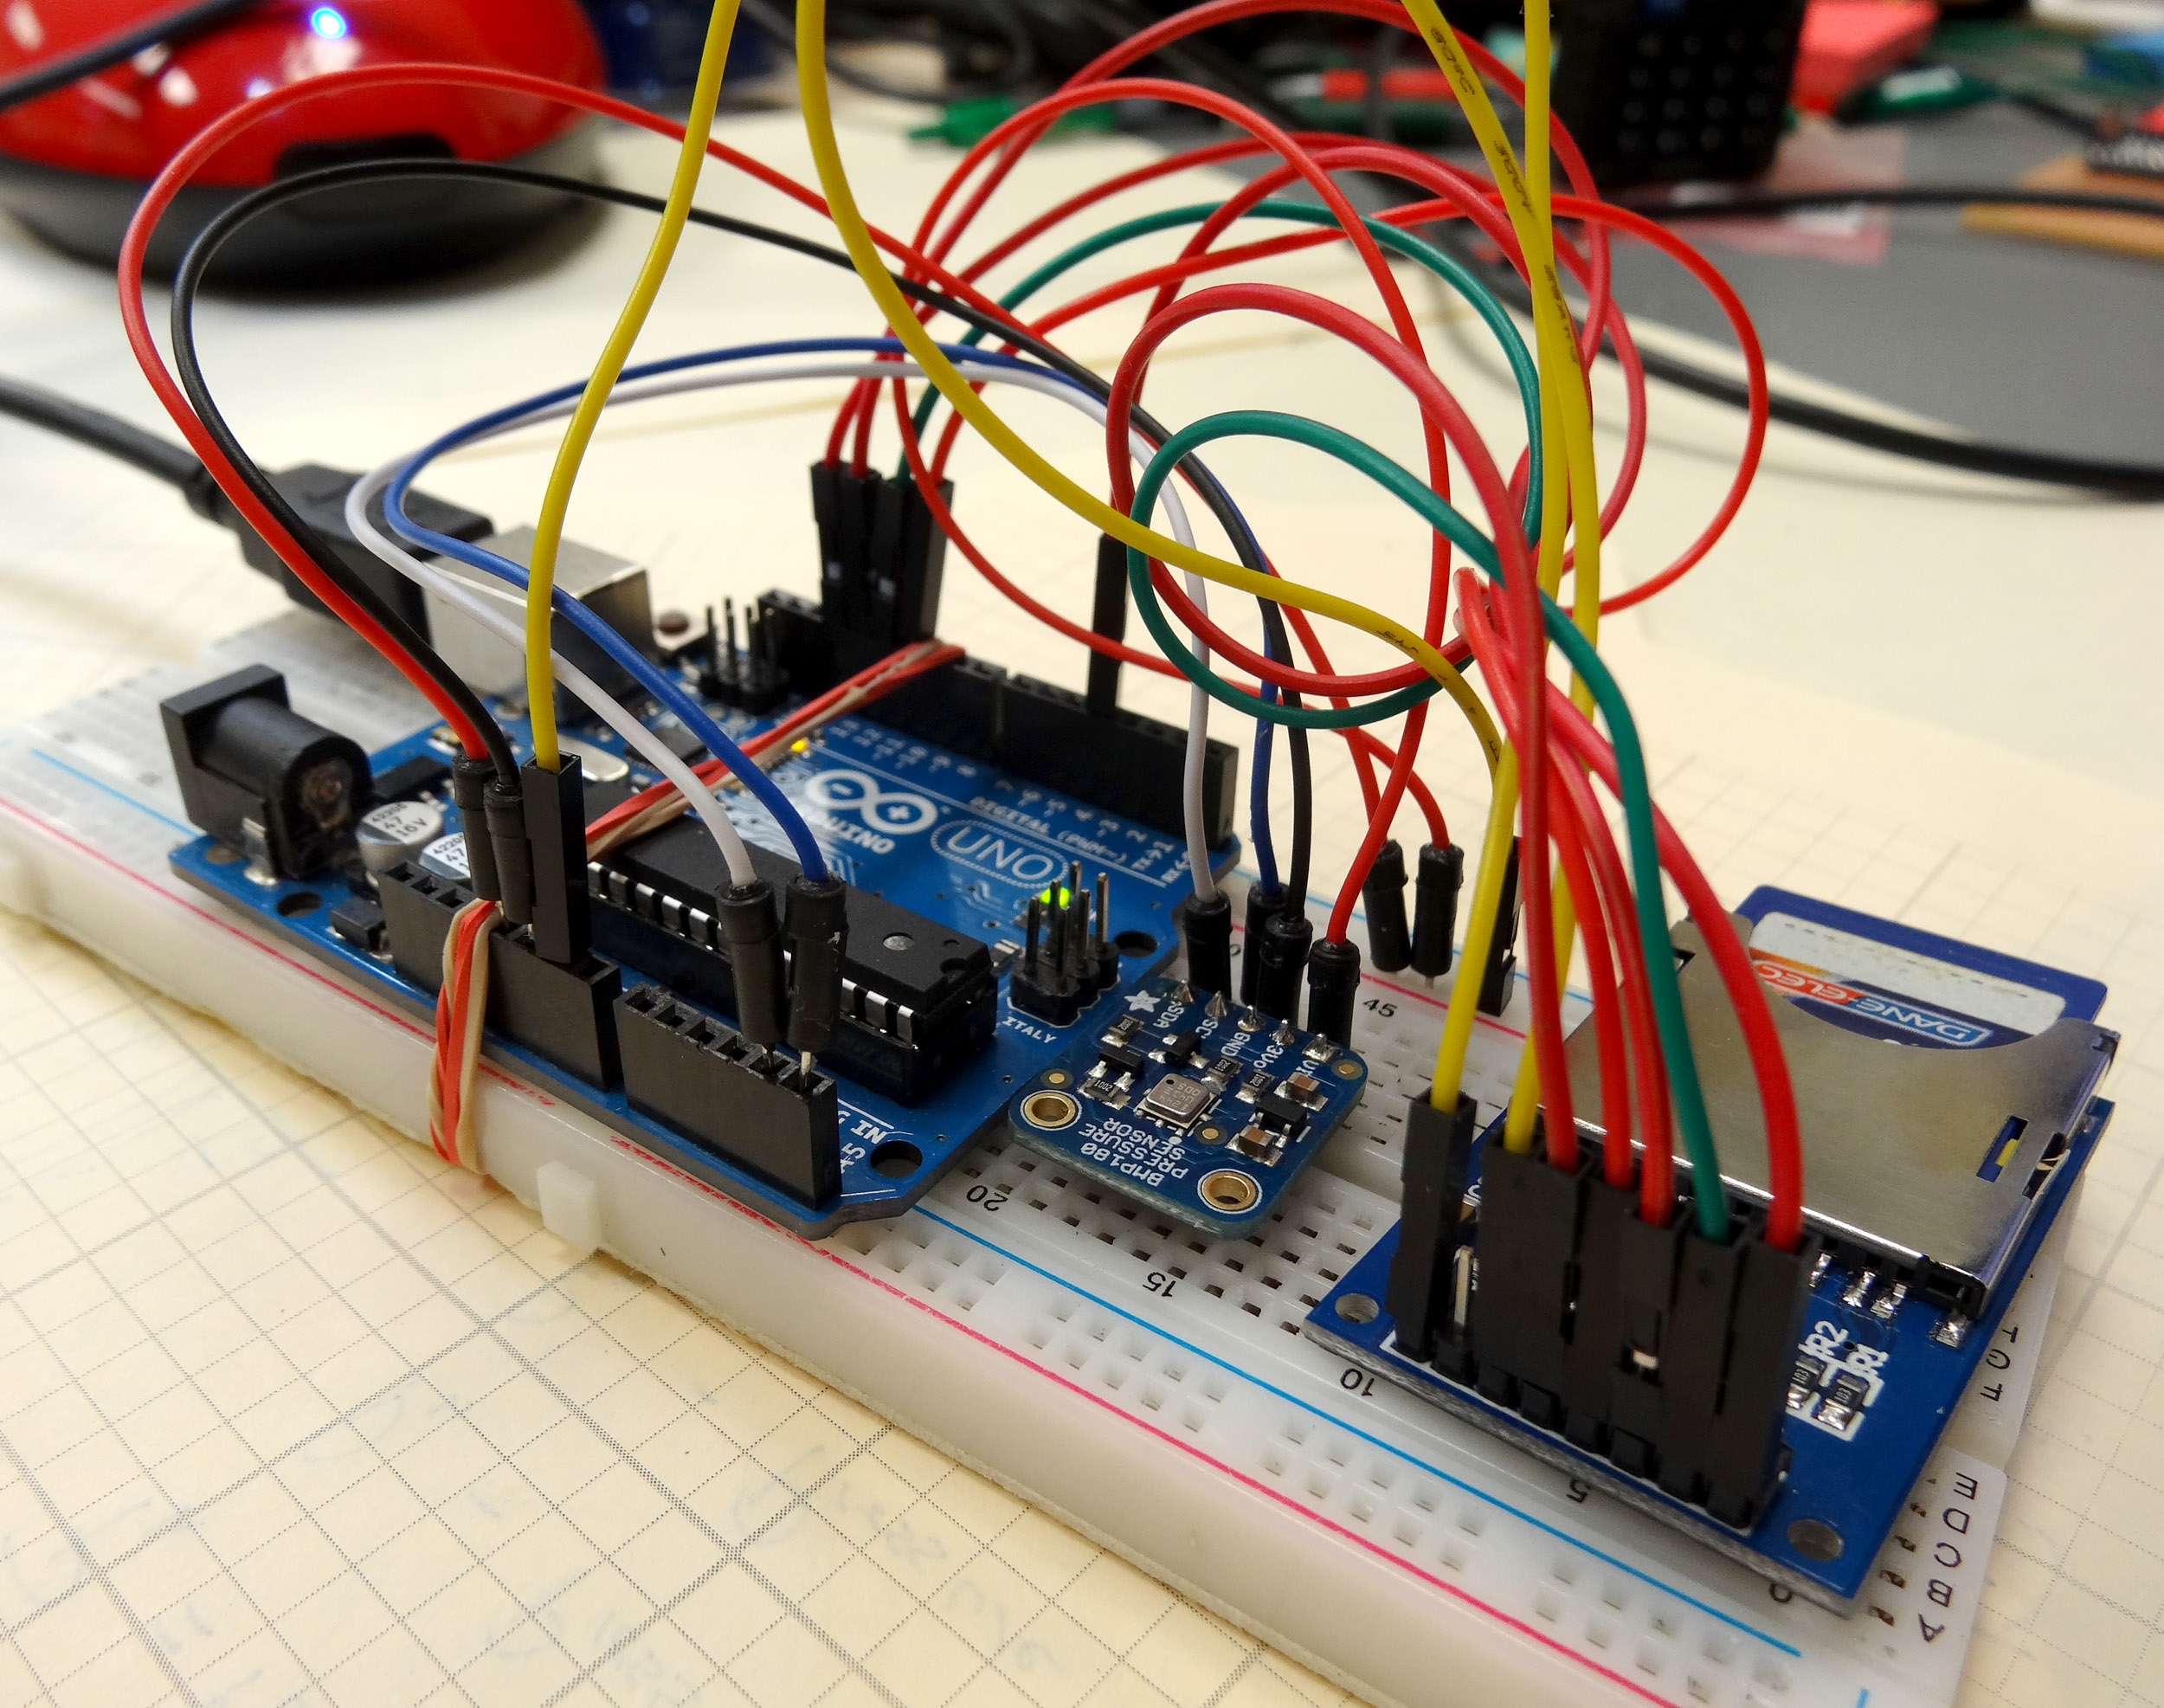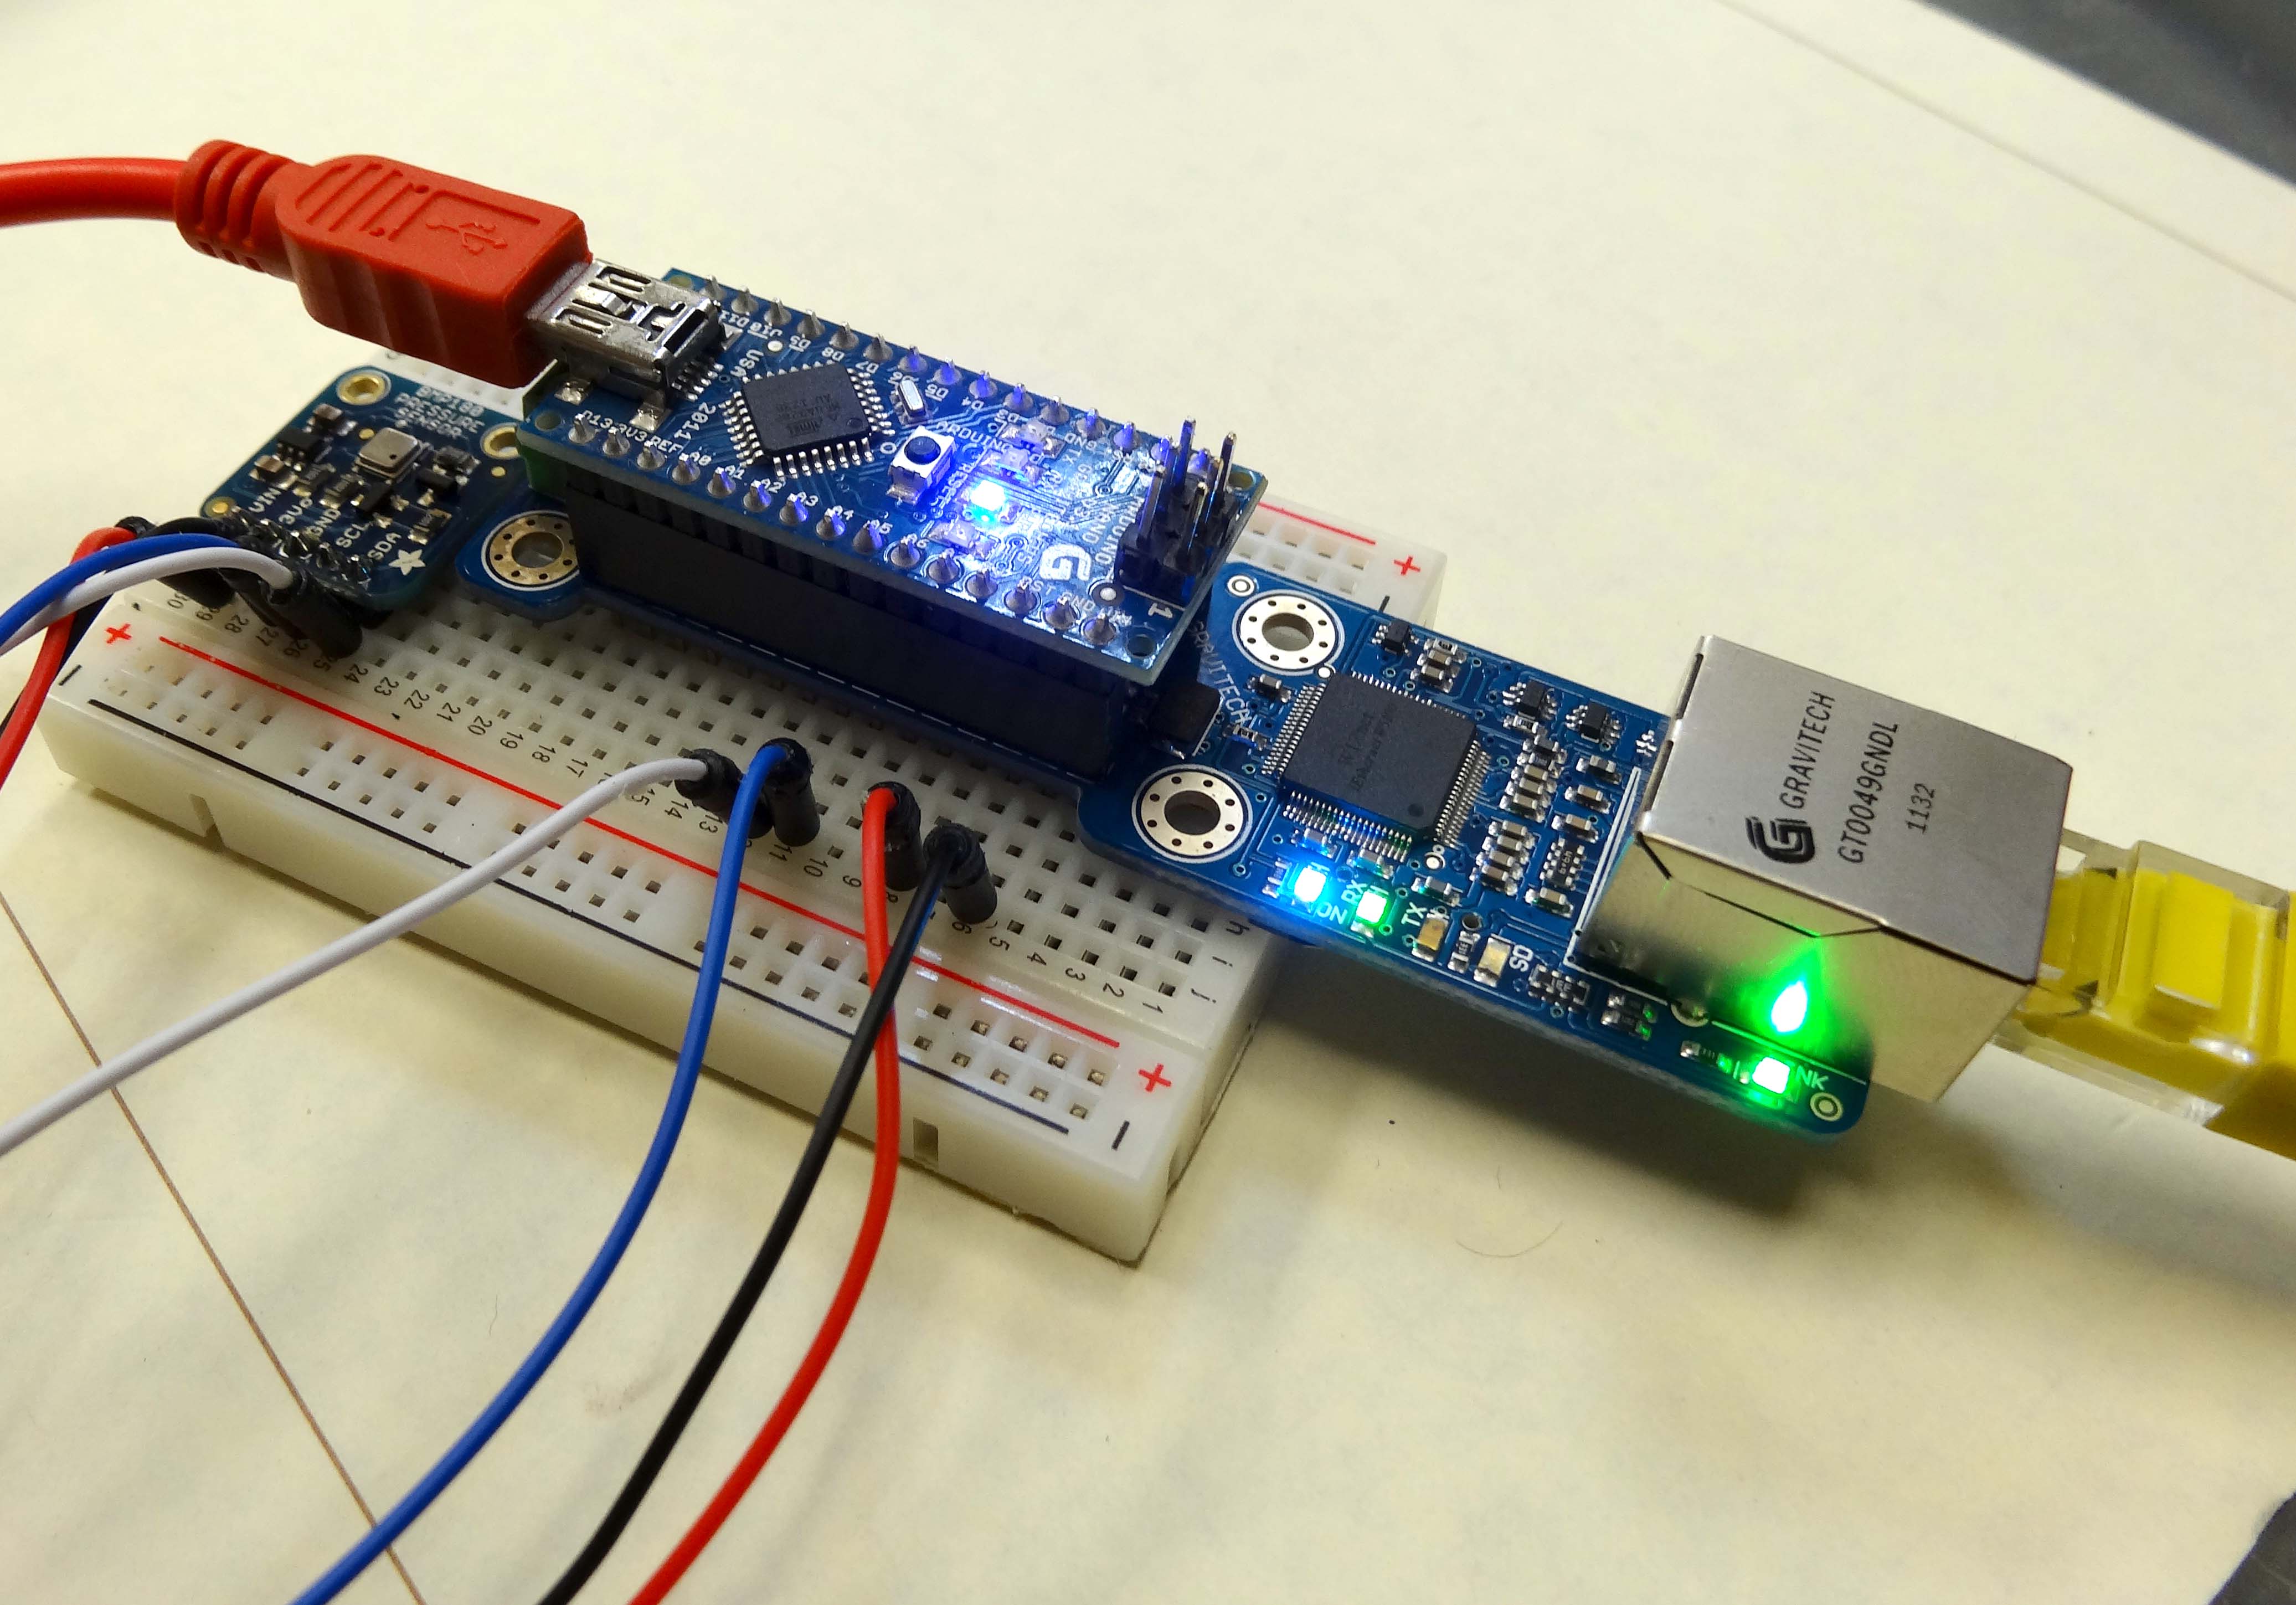
In LESSON 16 we showed a simple Client Server model that allows us to send strings between Python running on a PC and the arduino over Ethernet. That lesson simply passed strings back and forth to show a very basic Server on Arduino, and Python acting as the Client. In this lesson we show a more practical example, with the Arduino connected to an Adafruit BMP180 Pressure Sensor. In order to complete this lesson, you will need an Arduino, an Ethernet Shield, and the Pressure Sensor. If you do not have this particular pressure sensor, you can probably follow along in the lesson using whatever sensor you have that is of interest. The video will take you through the tutorial step-by-step, and then the code we developed is shown below.
The key issue in getting this project to work is to get your mac address and IP address from your router or network. If you are at school, simply speak to your network administrator, and he will help you get an IP address for your arduino. If you are at home, you will need to connect to your router from a browser, and configure it to assign an IP address and agree on a mac address for your arduino. Some arduino Ethernet shields have a sticker with a mac address. If your Ethernet shield has a sticker with mac address, use that one. If it does not, you will need to come up with a unique mac address. There are thousands of possible routers and networks out there, so I can not help you with that part. But if you look in the router documentation, you should be able to get the IP address and mac address worked out. The arduino itself does not have a hard wired mac address, but you set the mac address in the arduino software, and the IP address as well. The key thing is that the mac address is unique on your network, and the router and arduino agree on the IP address and mac address. If you have a clearer way to explain this, please leave a comment below.

This is the server side software to run on the arduino. Again, you should use a suitable IP address and mac address for your network. Do not think you can just copy the ones I use in the code below.
|
1 2 3 4 5 6 7 8 9 10 11 12 13 14 15 16 17 18 19 20 21 22 23 24 25 26 27 28 29 30 31 32 33 34 35 36 37 38 39 40 41 42 43 44 45 46 47 48 49 50 51 52 53 54 55 56 57 58 59 60 61 62 63 64 |
#include <Ethernet.h> //Load Ethernet Library #include <EthernetUdp.h> //Load the Udp Library #include <SPI.h> //Load SPI Library #include "Wire.h" //imports the wire library #include "Adafruit_BMP085.h" // import the Pressure/Temperature sensor library Adafruit_BMP085 mySensor; //Create a sensor object float tempC; //Declare variable for Temp in C float tempF; //Declare variable for Temp in F float Pressure; //Declare a variable for Pressure byte mac[] ={ 0xDE, 0xAD, 0xBE, 0xEF, 0xFE, 0xEE}; //Assign mac address IPAddress ip(10, 1, 15, 243); //Assign the IP Adress unsigned int localPort = 5000; // Assign a port to talk over char packetBuffer[UDP_TX_PACKET_MAX_SIZE]; //dimensian a char array to hold our data packet String datReq; //String for our data int packetSize; //Size of the packet EthernetUDP Udp; // Create a UDP Object void setup() { Serial.begin(9600); //Initialize Serial Port Ethernet.begin( mac, ip); //Inialize the Ethernet Udp.begin(localPort); //Initialize Udp delay(1500); //delay mySensor.begin(); //initialize pressure-temp sensor } void loop() { packetSize =Udp.parsePacket(); //Reads the packet size if(packetSize>0) { //if packetSize is >0, that means someone has sent a request Udp.read(packetBuffer, UDP_TX_PACKET_MAX_SIZE); //Read the data request String datReq(packetBuffer); //Convert char array packetBuffer into a string called datReq if (datReq =="Temperature") { //Do the following if Temperature is requested tempC = mySensor.readTemperature(); //Read the temperature tempF = tempC*1.8 + 32; //Convert temp to F Udp.beginPacket(Udp.remoteIP(), Udp.remotePort()); //Initialize packet send Udp.print(tempF); //Send the temperature data Udp.endPacket(); //End the packet } if (datReq== "Pressure") { //Do the following if Pressure is requested Pressure=mySensor.readPressure(); //read the pressure Udp.beginPacket(Udp.remoteIP(), Udp.remotePort()); //Initialize packet send Udp.print(Pressure); //Send the Pressure data Udp.endPacket(); //End the packet } } memset(packetBuffer, 0, UDP_TX_PACKET_MAX_SIZE); //clear out the packetBuffer array } |
Once you have this on your arduino, and the arduino connected to the internet via an Ethernet cable, you can test by opening a command line in Windows. Then ping the address you have assigned to the Arduino. If it pings correctly and you get a reply, you are ready to develop the Python code. The Python will be the client. It will send the requests to the Arduino, and the Arduino will respond with data. Since our circuit can measure pressure or temperature, you can request either of those. When the arduino receives a request for temperature, it will go out, make the temperature measurement and then return the data to Python. Similarly, if you request Pressure the arduino will read the request, will make the Pressure measurement, and then return pressure reading to the client (Python).
|
1 2 3 4 5 6 7 8 9 10 11 12 13 14 15 16 17 18 19 20 21 22 23 24 25 26 27 28 29 30 31 32 33 34 35 36 37 38 39 40 |
from socket import * import time address= ( '10.1.15.243', 5000) #define server IP and port client_socket =socket(AF_INET, SOCK_DGRAM) #Set up the Socket client_socket.settimeout(1) #Only wait 1 second for a response while(1): data = "Temperature" #Set data request to Temperature client_socket.sendto( data, address) #Send the data request try: rec_data, addr = client_socket.recvfrom(2048) #Read response from arduino temp = float(rec_data) #Convert string rec_data to float temp print "The Measured Temperature is ", temp, " degrees F." # Print the result except: pass time.sleep(2) #delay before sending next command data = "Pressure" #Set data request to Pressure client_socket.sendto( data, address) #Send the data request try: rec_data, addr = client_socket.recvfrom(2048) #Read response from arduino Pressure = float(rec_data) #Convert string rec_data to float temp print "The Measured Pressure is ", Pressure, " Pa." # Print the result except: pass time.sleep(2) #delay before sending next command print "" |
This python code will request Temperature, will then read the response, and then will print the data. It then requests Pressure, reads the response, and then prints it. If you look at our earlier lessons you can see graphical techniques to visually present the data. The hard part is getting the data passed back and forth, which we show how to do in this lesson.