


One of our goals with this series of lessons is to learn how to plot live data in Python. To do that, we need some interesting streaming data from the Arduino. In this lesson we will provide a live stream of temperature and pressure data. We will hook up the circuit, program the arduino, and stream the temperature and pressure data over the serial port. Then in the next lesson, we will read the data stream into Python, and provide a live plot of the incoming data. We will be using the Adafruit BMP180 Pressure Sensor.

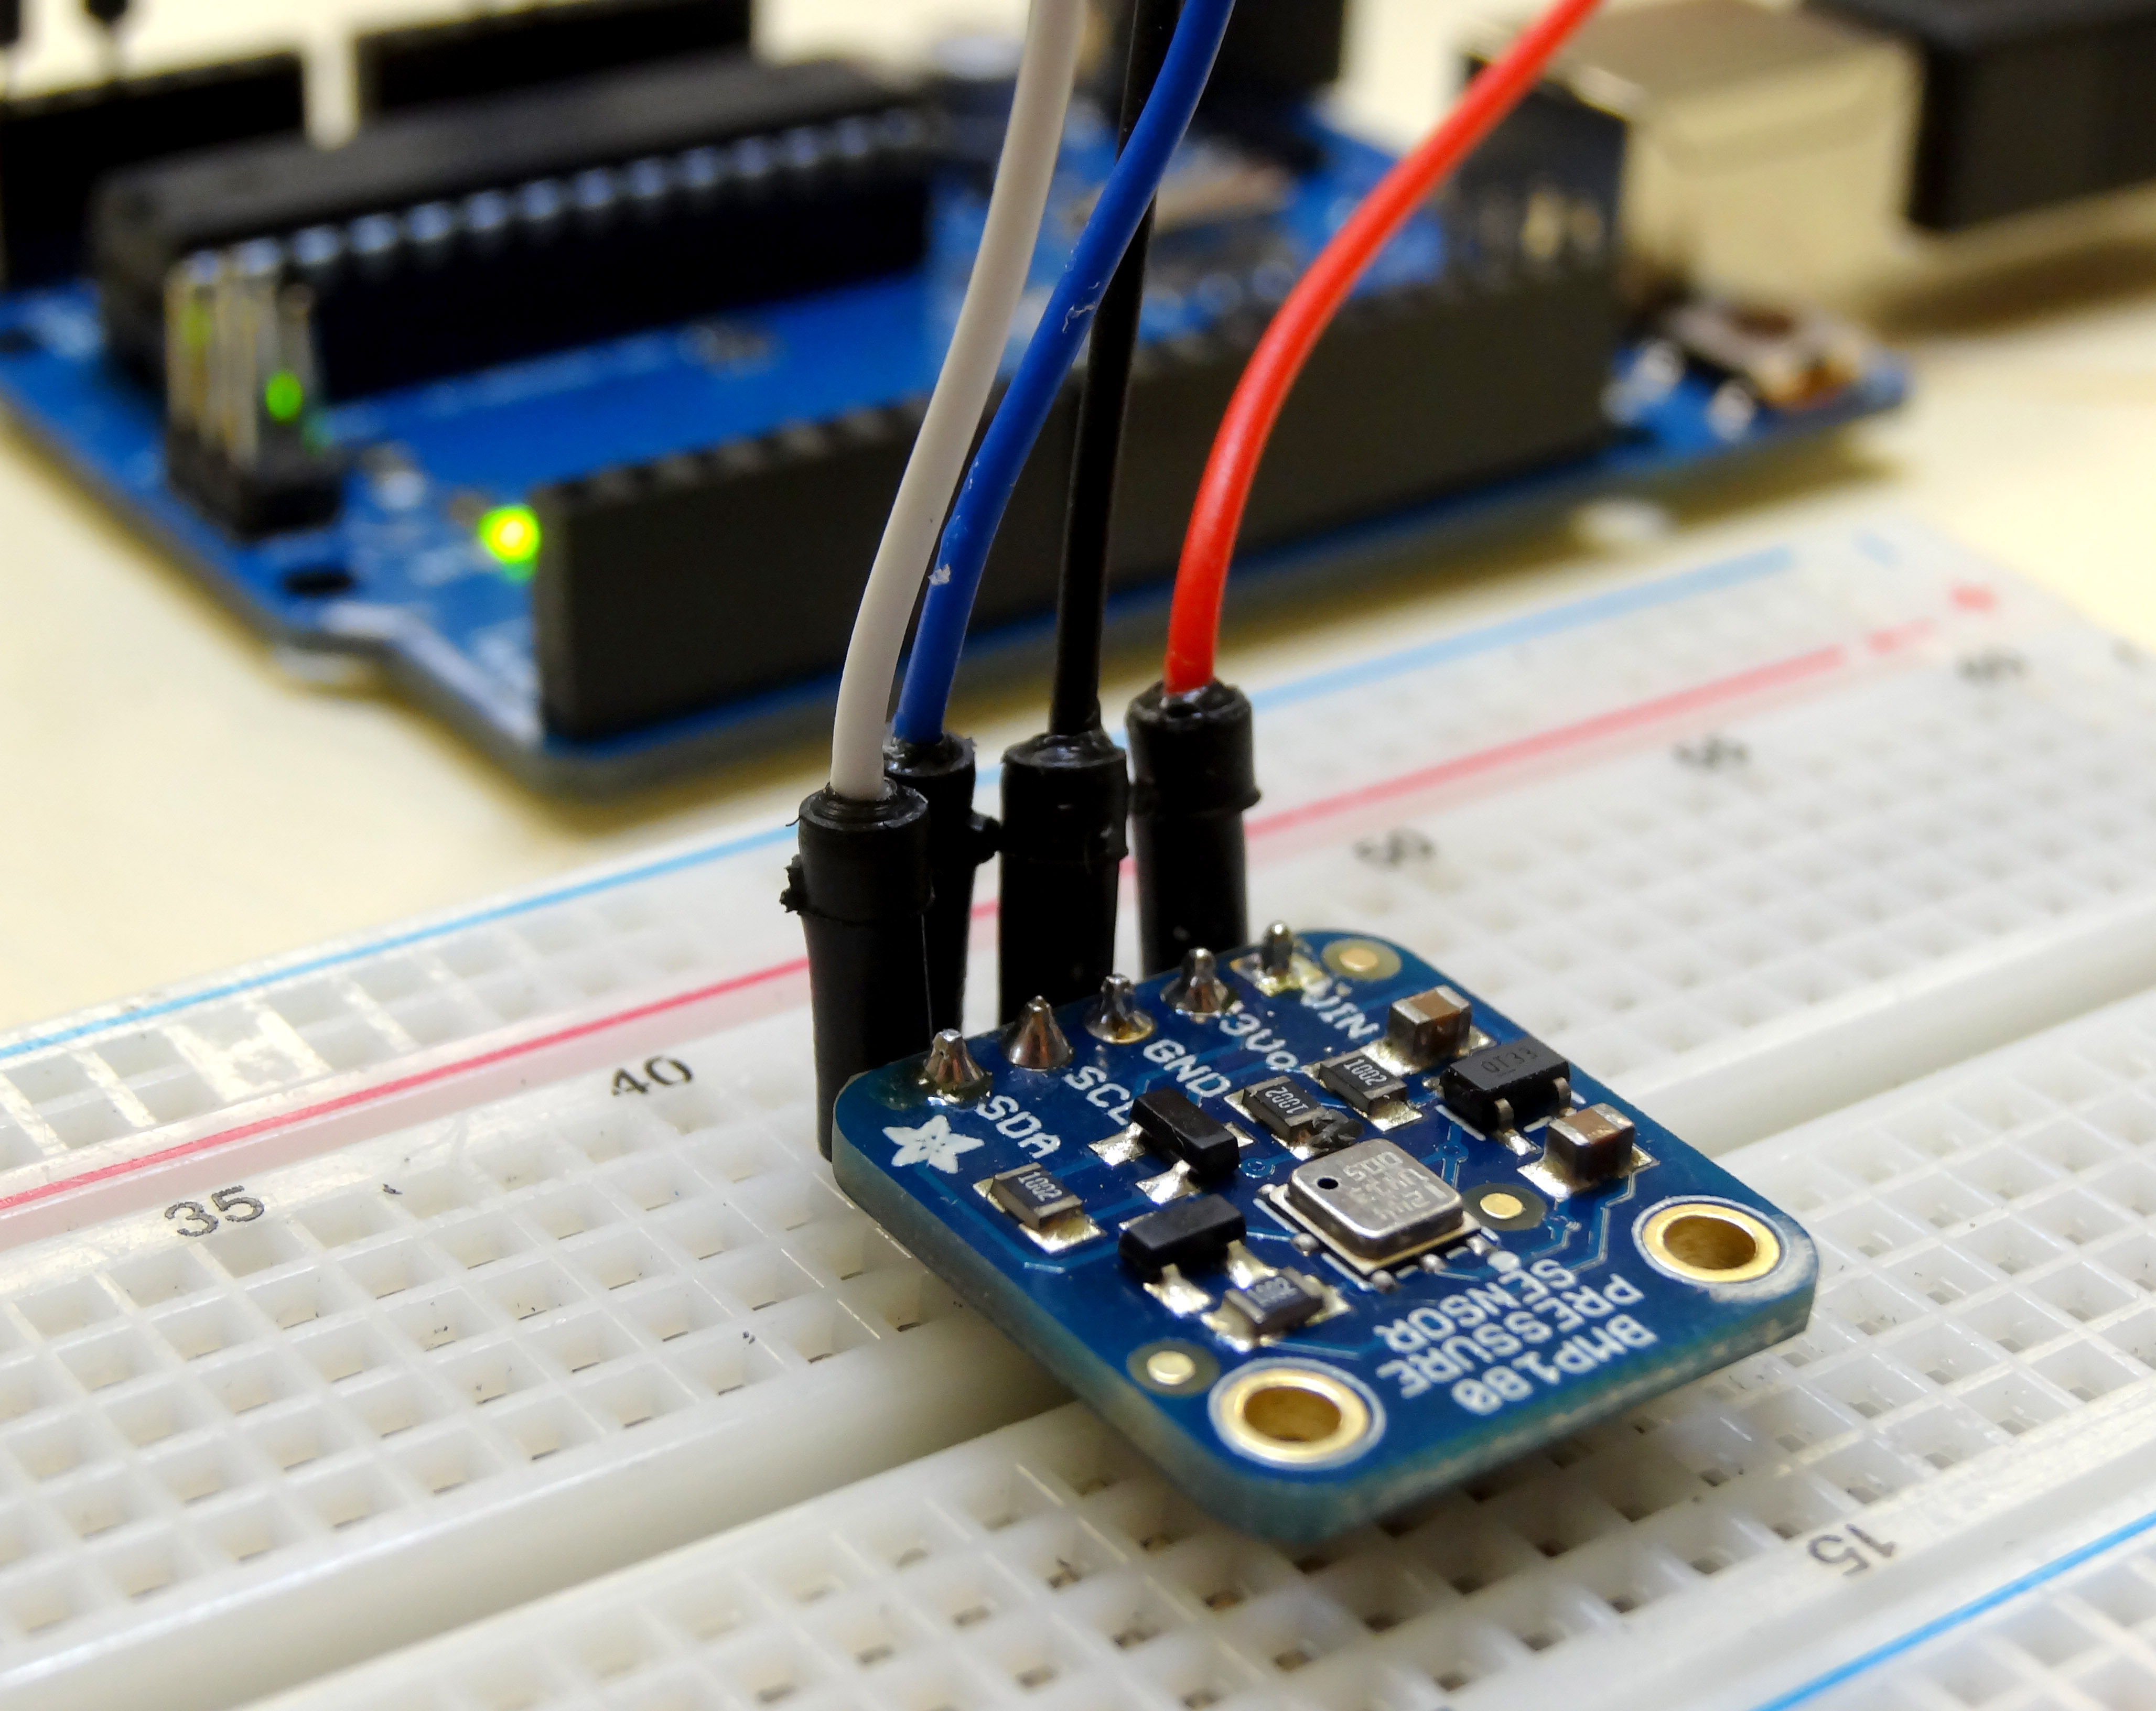
This is a really simple sensor to get set up. To connect it up, use the following connections:
Connecting Up the BMP180 Pressure and Temperature Sensor |
|
| BMP180 Pin | Arduino Pin |
| Vin | 5V |
| GND | GND |
| SCL | A5 |
| SDA | A4 |
With the circuit hooked up, you are ready to start coding. The first thing you will need to do is to download and install the adafruit library for this component. I prefer the API V1 version of the library, so we will download that one. Do not worry that the documentation lists a different part number. This is an upgraded version of the sensor, and the documentation still references the old part number. You can download the library for this part here:
https://learn.adafruit.com/bmp085/using-the-bmp085
Click the “Download the Adafruit_BMP085 Arduino Library” large green box. This will download as a zip folder. Open the zip folder, and then drag and drop the contents on your desktop. You want the contents of the zip folder, not the zip folder itself. Rename the folder you dropped to your desktop “adafruitBMP180”. Now you need to drag and drop this folder into your arduino library folder. To find your arduino library folder, in the arduino IDE window, look in file, preferences. A window should pop open, and it should show you where your arduino sketchbook folder is. Drop your adafruitBMP180 folder into the Library folder of your arduino sketchbook folder. If this is not perfectly clear, watch the video above and you can watch me do it step-by-step. Once your adafruitBMP180 folder is in your arduino library folder, you are ready to start writing your code. You need to kill your arduino IDE window and reopen it for it to find your new library.
Now, to get this sensor to work, you just need a few lines of code. To begin with, you must load the Wire.h library and the Adafruit_BMP085.h library (again, do not worry that the library is named after an earlier model of this sensor). After loading the libraries, you will need to create a sensor object. Then in void setup you will need to start the sensor, and then in void loop begin making measurements. The code below is a nice example of how to do this.
|
1 2 3 4 5 6 7 8 9 10 11 12 13 14 15 16 17 18 19 20 21 22 23 24 25 26 27 |
#include "Wire.h" // imports the wire library for talking over I2C #include "Adafruit_BMP085.h" // import the Pressure Sensor Library Adafruit_BMP085 mySensor; // create sensor object called mySensor float tempC; // Variable for holding temp in C float tempF; // Variable for holding temp in F float pressure; //Variable for holding pressure reading void setup(){ Serial.begin(9600); //turn on serial monitor mySensor.begin(); //initialize mySensor } void loop() { tempC = mySensor.readTemperature(); // Read Temperature tempF = tempC*1.8 + 32.; // Convert degrees C to F pressure=mySensor.readPressure(); //Read Pressure Serial.print("The Temp is: "); //Print Your results Serial.print(tempF); Serial.println(" degrees F"); Serial.print("The Pressure is: "); Serial.print(pressure); Serial.println(" Pa."); Serial.println(""); delay(250); //Pause between readings. } |
Now run the program and check your serial monitor and you should see measurements of temperature and pressure. Pressure in Pascals is a big number. To convert Pascals to inches of Mercury, or in Hg, which is what the weather sites usually report, take the Pascal reading, and divide by 3386.389. Then you should be in Inches of Mercury and you can check your reading against a weather report for your area. The numbers should be close.