We now have all the pieces put together to allow us to plot live data from the Arduino. If you have kept up with the earlier lessons, you will now have everything you need. If you have not done the earlier lessons, make sure you have python 2.7, vPython and pySerial installed from Python with Arduino LESSON 2. Make sure you have installed matplotlib (Python with Arduino LESSON 7), and install drawnow (Python with Arduino LESSON 10). Also, you need to build the BMP180 circuit and get the arduino programmed up as explained in Python with Arduino LESSON 9. With this business taken care of, you are now ready to start plotting live data.

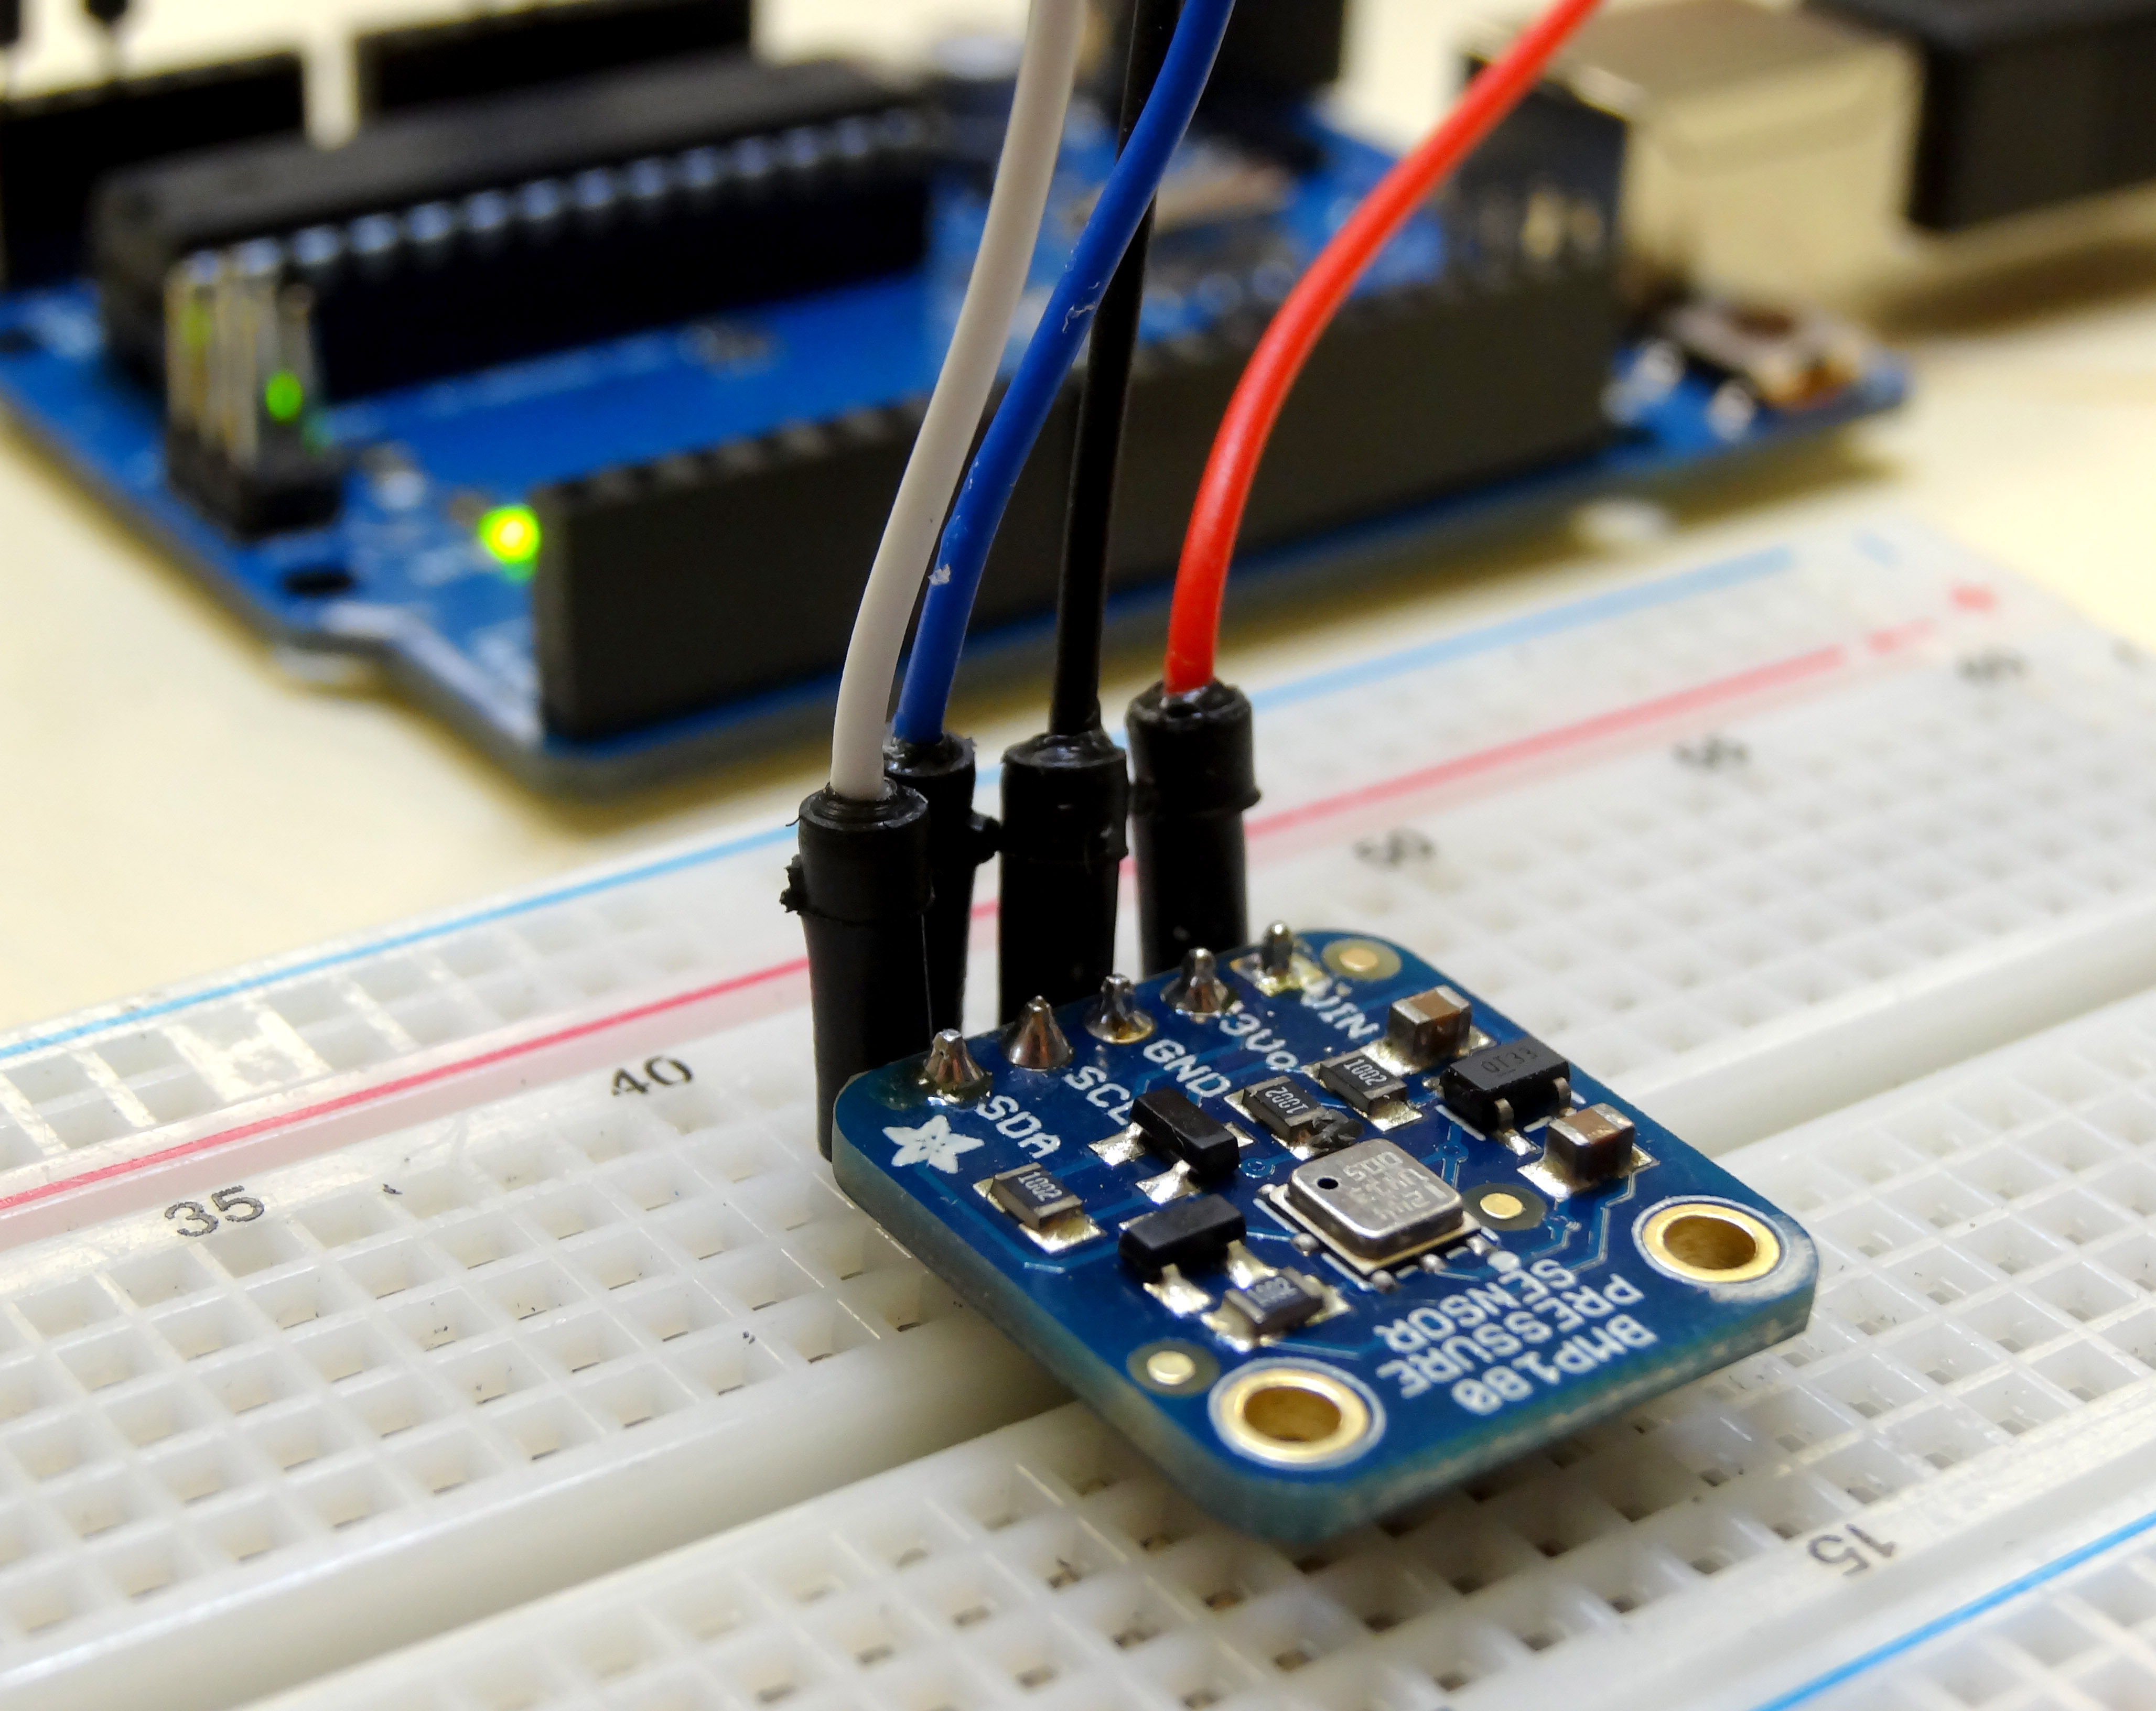
We are using the Adafruit BMP180 pressure sensor. We showed how to hook it up and program it in LESSON 9. As a reminder, we are using this code for the arduino. LESSON 9 explained in detail how the code works.
1 2 3 4 5 6 7 8 9 10 11 12 13 14 15 16 17 18 19 20 21 22 23 24 | #include "Wire.h" // imports the wire library for talking over I2C #include "Adafruit_BMP085.h" // import the Pressure Sensor Library Adafruit_BMP085 mySensor; // create sensor object called mySensor float tempC; // Variable for holding temp in C float tempF; // Variable for holding temp in F float pressure; //Variable for holding pressure reading void setup(){ Serial.begin(115200); //turn on serial monitor mySensor.begin(); //initialize mySensor } void loop() { tempC = mySensor.readTemperature(); // Be sure to declare your variables tempF = tempC*1.8 + 32.; // Convert degrees C to F pressure=mySensor.readPressure(); //Read Pressure Serial.print(tempF); Serial.print(" , "); Serial.println(pressure); delay(250); //Pause between readings. } |
The video in this lesson above explains step-by-step how to develop the code on the Python side, and how matplotlib and drawnow work together to make live graphs and plots of data streaming from the arduino in real time. The code below is what we developed in the video. Do not simply cut and paste this code, but make sure that you understand it so you are able to create your own live graphing programs from scratch. If you are in my class, you will be required to be able to develop live graphing code like this from scratch, so don’t take a shortcut and copy and paste.
1 2 3 4 5 6 7 8 9 10 11 12 13 14 15 16 17 18 19 20 21 22 23 24 25 26 27 28 29 30 31 32 33 34 35 36 37 38 39 40 41 | import serial # import Serial Library import numpy # Import numpy import matplotlib.pyplot as plt #import matplotlib library from drawnow import * tempF= [] pressure=[] arduinoData = serial.Serial('com11', 115200) #Creating our serial object named arduinoData plt.ion() #Tell matplotlib you want interactive mode to plot live data cnt=0 def makeFig(): #Create a function that makes our desired plot plt.ylim(80,90) #Set y min and max values plt.title('My Live Streaming Sensor Data') #Plot the title plt.grid(True) #Turn the grid on plt.ylabel('Temp F') #Set ylabels plt.plot(tempF, 'ro-', label='Degrees F') #plot the temperature plt.legend(loc='upper left') #plot the legend plt2=plt.twinx() #Create a second y axis plt.ylim(93450,93525) #Set limits of second y axis- adjust to readings you are getting plt2.plot(pressure, 'b^-', label='Pressure (Pa)') #plot pressure data plt2.set_ylabel('Pressrue (Pa)') #label second y axis plt2.ticklabel_format(useOffset=False) #Force matplotlib to NOT autoscale y axis plt2.legend(loc='upper right') #plot the legend while True: # While loop that loops forever while (arduinoData.inWaiting()==0): #Wait here until there is data pass #do nothing arduinoString = arduinoData.readline() #read the line of text from the serial port dataArray = arduinoString.split(',') #Split it into an array called dataArray temp = float( dataArray[0]) #Convert first element to floating number and put in temp P = float( dataArray[1]) #Convert second element to floating number and put in P tempF.append(temp) #Build our tempF array by appending temp readings pressure.append(P) #Building our pressure array by appending P readings drawnow(makeFig) #Call drawnow to update our live graph plt.pause(.000001) #Pause Briefly. Important to keep drawnow from crashing cnt=cnt+1 if(cnt>50): #If you have 50 or more points, delete the first one from the array tempF.pop(0) #This allows us to just see the last 50 data points pressure.pop(0) |
You should be seeing data like the graph on the top of this lesson. You will probably need to adjust your y-axis scale parameters in Python to ensure the scale is suitable for the data you are taking. If your chart is blank, likely your y-scales are not right for your data measurements.